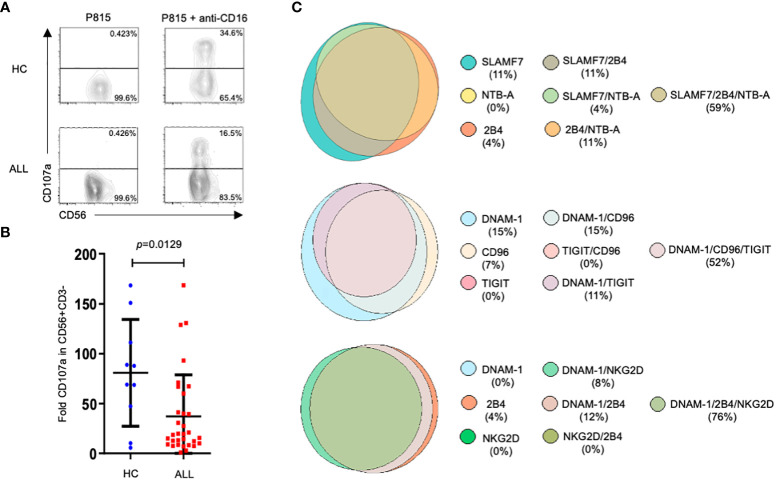
Figure 6.
Degranulation assays in NK cells from ALL patients and healthy controls. Representative FACS plots depict NK cell response (CD107a degranulation) against P815 supplemented or not with anti-CD16 (clone 4G6). (A) PBMCs (1x10⁶/ml) were incubated with P815 cells (2x10⁶/ml) for 3 hours in a total volume of 200 ul in a 96 well plate at 37°C. Degranulation was represented as the fold increase of CD107a on NK cell surface, which is the difference between the percentage of NK cells expressing CD107a at surface after stimulation with P815 cells supplemented with agonist mAb, and the percentage of NK cells expressing CD107a at NK cell surface after incubation with P815 cells with no agonist mAb. NK cell degranulation assays were performed in 32 ALL patients and 10 age-matched controls. (B) Summary of data and statistic from 32 ALL patients and 10 age-matched controls. (C) Venn diagrams showing the number of functions as defined by Boolean gating. The diagrams show the concurrent expression of various NK cell receptors in those patients that displayed degranulation values under the 50th percentile.

