Figure 8.
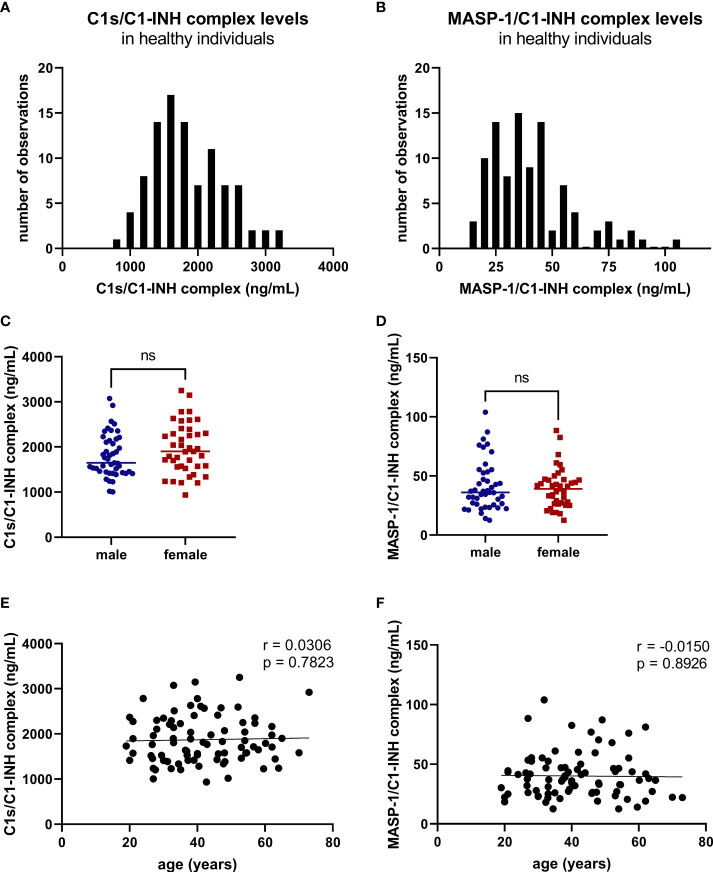
C1-INH complex levels in healthy adult individuals. C1-INH complex concentrations were measured in 96 healthy adult individuals, using the new immunoassays. Distributions of C1s/C1-INH complex (A) and MASP-1/C1-INH complex concentrations (B) are shown in histograms. Concentrations in healthy adults were furthermore stratified according to gender (C: C1s/C1-INH complex, D: MASP-1/C1-INH complex) and age (E: C1s/C1-INH complex, F: MASP-1/C1-INH complex). No significant differences between males (n=50) and females (n=46) were observed when comparing the groups using Mann-Whitney test. ns, not significant; r, correlation coefficient.

