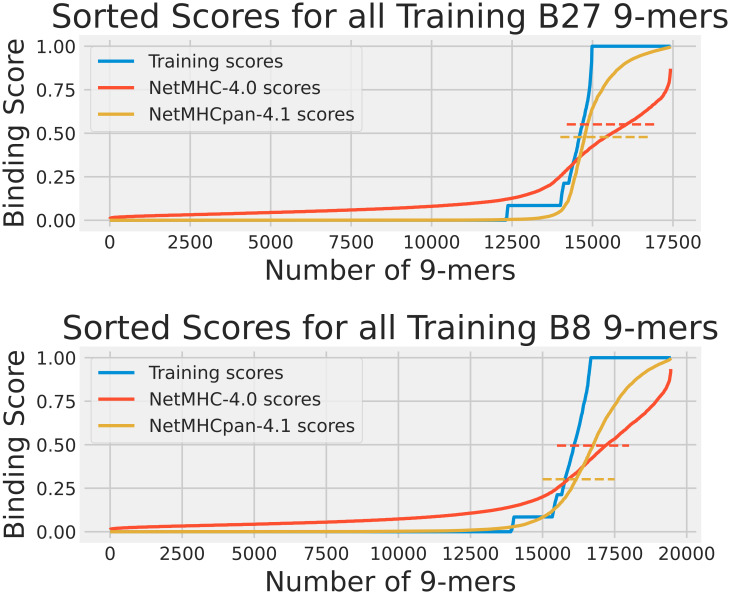
Figure 1.
The cumulative distribution of the experimental training scores (blue), NetMHC-4.0 predicted scores (red), and NetMHCpan-4.1 predicted scores (yellow) for peptides in the training dataset for HLAs A2, B27, and B8. The strong binder thresholds for NetMHC-4.0 and NetMHCpan-4.1 are shown as dashed lines of the corresponding colors. For B27, these were 0.551 and 0.478, and for B8 these were 0.495 and 0.301 respectively. Each plot of scores was independently sorted. Consequently, the order of peptides is not conserved across the 3 plots in each subfigure. Note that the A2 results can be accessed from our previous study (15). For A2, the NetMHC-4.0 and NetMHCpan-4.1 thresholds were 0.659 and 0.419 respectively.

