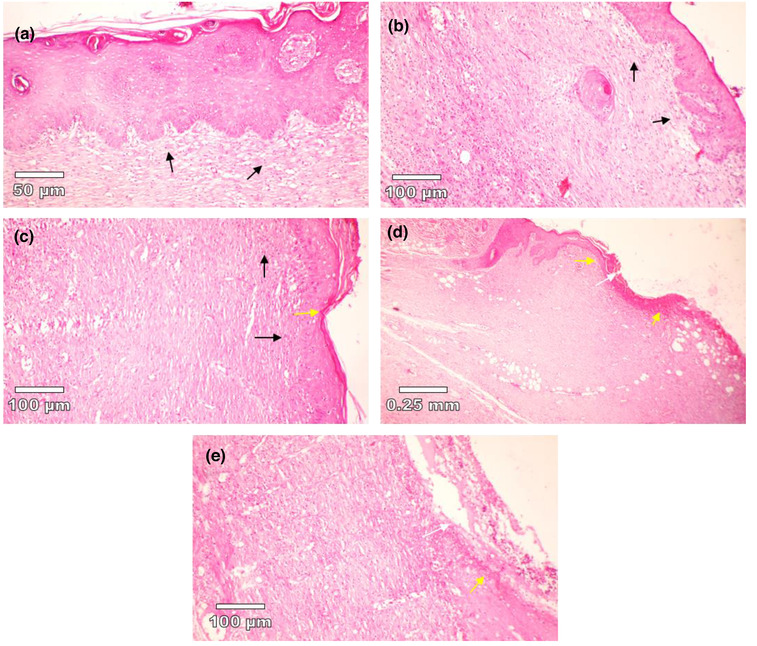
FIGURE 7.

Histopathology of skin at days 10 stained with H&E. (a) 20% v/v CCS treated group, (b) 10% v/v CCS treated group, (c) tetracycline‐treated group, (d) basal gel‐treated group, (e) negative control (without treatment). White arrows show ulceration that is visible in d and e images. Yellow arrows show early epithelisation. 20% and 10% CCS‐treated groups showed a large amount of granulation tissue (black arrow). 20% treated group showing healed skin structure with near to normal epidermis; also fibrosis and collagen tissue is notable in the dermis. No quality image enhancement software was used.
