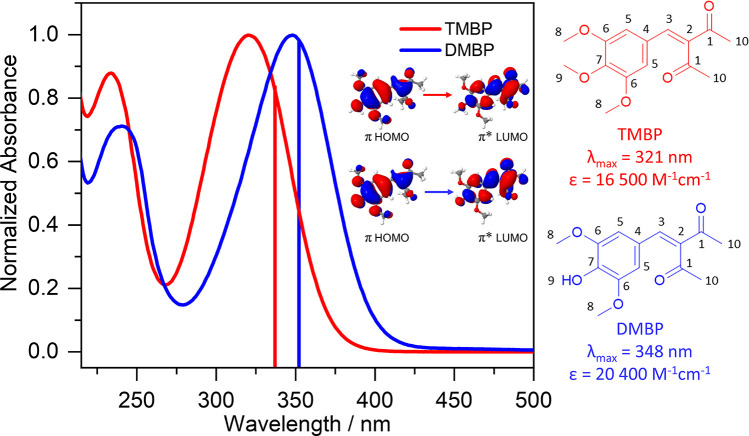
Figure 1.
Steady-state UV–visible absorption spectra of TMBP (red) and DMBP (blue) obtained in ethanol. The wavelength of the theoretically predicted strongest transition (corresponding transition orbitals shown inset) for each molecule is presented as a vertical line, with the color matching the corresponding experimental absorption spectrum. Also shown are the structures of TMBP (red) and DMBP (blue), the λmax, and the extinction coefficient.

