Figure 3.
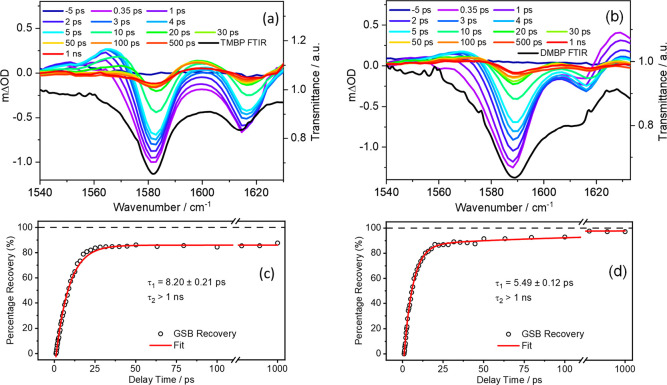
TVA spectra obtained for 30 mM ethanolic solutions of (a) TMBP and (b) DMBP, both photoexcited at their respective λmax and using a broadband IR probe pulse centered at 1580 cm–1 for TMBP and 1590 cm–1 for DMBP. Both spectra are presented as smoothed colored line plots of mΔOD (left-hand y-axis) vs probe wavenumber at selected pump–probe delay times. The steady-state FTIR spectra are shown as black lines in the respective panels, with the transmittance scale shown on the right-hand y-axis. The kinetics of (c) TMBP and (d) DMBP GSB recovery for the prominent vibrational bands (raw data as open circles and fit as solid red line) centered at ∼1580 cm–1 for TMBP and ∼1590 cm–1 for DMBP are also reported. In both TVA spectra, the data were fitted with biexponential functions with the delay times plotted linearly until 110 ps; then, there is a break until 600 ps beyond which the 600–1000 ps data are plotted on a logarithmic scale to show incomplete GSB recovery.

