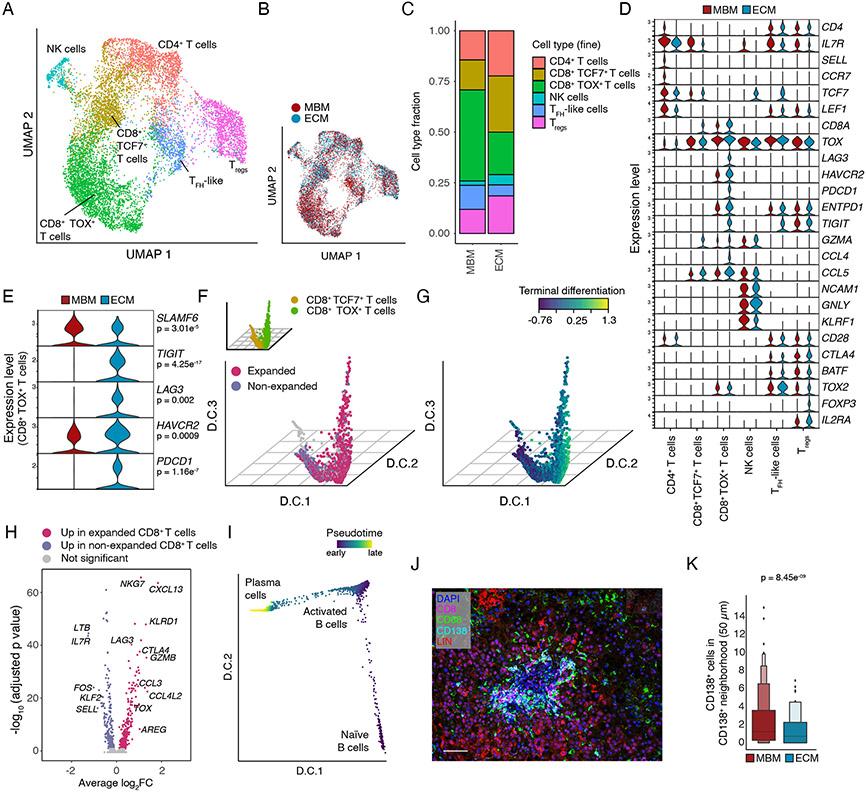
Figure 5. Transcriptional and clonal T and B cell landscape in MBM.
(A,B) UMAP embedding of T/NK cells profiled by snRNA-seq showing cell type assignment (A) and tissue origin (B). (C) Fraction of T/NK cell subsets shown in (A). (D) Violin plots of selected genes (rows) in T/NK cell subsets (columns) and separated by tissue origin. (E) Violin plots of CD8+ TOX+ T cells profiled by snRNA-seq showing differentially expressed immune checkpoints (rows) by tissue origin. MAST, adj. p-value as indicated. (F) D.C. 1-3 of CD8+ T cells (profiled by scRNA-seq) indicating subsets (TCF7+ or TOX+, inset) and clonal expansion. (G) T cell terminal differentiation signature score on in D.C. embedding shown in (F). (H) Volcano plot depicting DGE of expanded and non-expanded CD8+ T cells in MBM profiled by scRNA-seq. (I) D.C. embedding of B cell differentiation showing pseudotime projection in B and plasma cells profiled by sc/snRNA-seq. (J) Exemplary IF micrograph showing plasma cell aggregates in an MBM. Scale bar = 100 μm. (K) Box plot showing local neighborhood in MBM and ECM quantifying number of CD138+ plasma cells in direct vicinity of CD138+ plasma cells as a metric for plasma cell clustering in tissue. Boxes display mean and quartiles, Wilcoxon rank-sum test.

