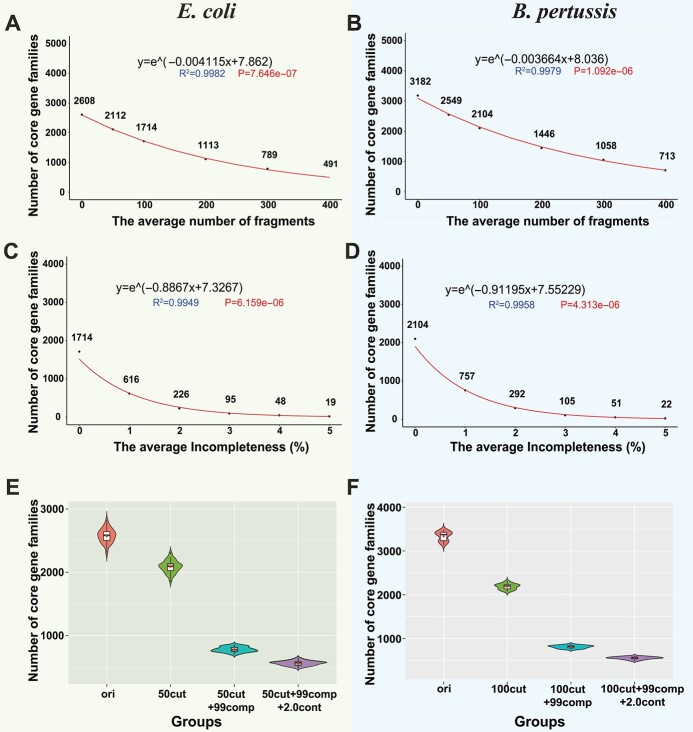
Figure 2.
Core genome sizes decrease in simulated MAGs of Escherichia coli and Bordetella pertussis. (A) and (B) The core genome size continuously decreases as the simulated MAGs become more fragmented. The red curve was predicted using an exponential model for the correlation between the x-axis (the number of fragments) and the y-axis (the core genome size). (C) and (D) The core genome size decreases more rapidly as the simulated MAGs become less complete. (E) The violin plot of the core genome sizes in 50 E. coli original datasets and their corresponding simulated MAG datasets. (F) The violin plot of the core genome sizes in 30 B. pertussis original datasets and their corresponding simulated MAG datasets. Groups: ‘ori’ represents the original datasets; ‘50cut’ or ‘100cut’ represents the fragmentation datasets; ‘50cut + 99comp’ or ‘100cut + 99comp’ means that genomes in a dataset have an average of 1% incompleteness based on 50 or 100 fragmentation; ‘50cut + 99comp + 2.0cont’ or ‘100cut + 99comp + 2.0cont’ means that genomes in a dataset have an average of 2.0% intra-species contamination based on 50 or 100 fragmentation and 1% incompleteness. All the core genome sizes are calculated by using Roary with 90% identity and 100% CG thresholds.

