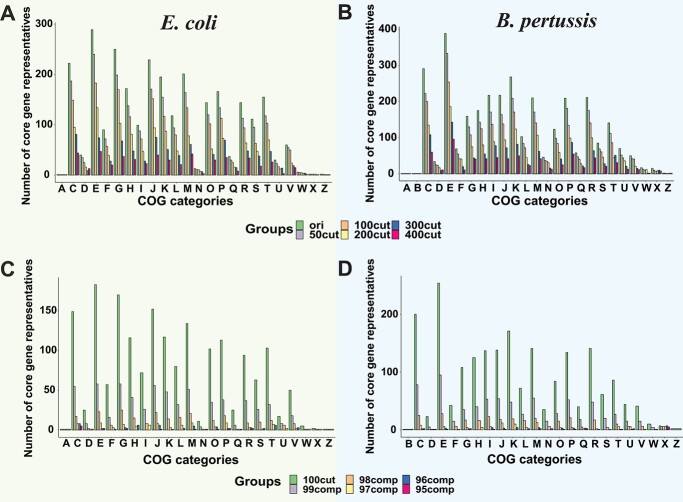
Figure 5.
The COG analysis of CGs in simulated MAGs. (A) and (B) The bar plots of the number of CGs with different fragmentation levels in each COG category. (C) and (D) The bar plots of the number of CGs with different incompleteness levels in each COG category. COG category single letter codes: A: RNA processing and modification, C: energy production and conversion, D: cell cycle control and mitosis, E: amino Acid metabolism and transport, F: nucleotide metabolism and transport, G: carbohydrate metabolism and transport, H: coenzyme metabolism, I: lipid metabolism, J: translation, K: transcription, L: replication and repair, M: cell wall/membrane/envelop biogenesis, N: cell motility, O: post-translational modification, protein turnover, chaperone functions, P: inorganic ion transport and metabolism, Q: secondary structure, R: general functional prediction only, S: function unknown, T: signal transduction; U: intracellular, trafficking and secretion, V: defense mechanisms, W: extracellular structures, X: mobilome: prophages, transposons, Z: cytoskeleton.

