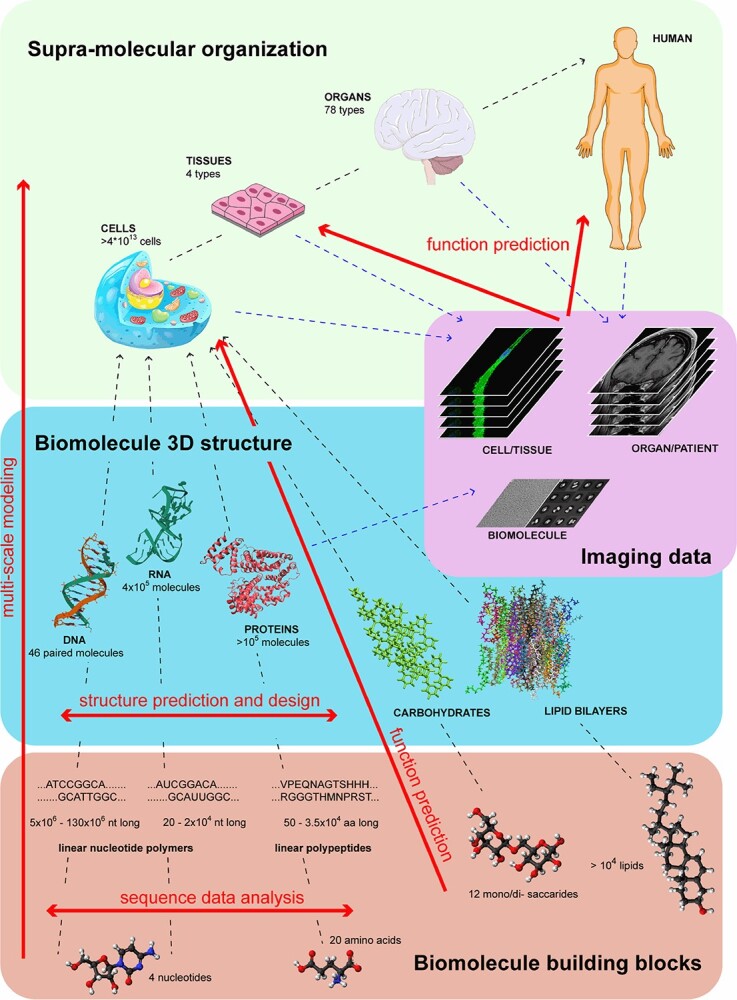
Figure 1.

The biomolecule landscape: organization, numbers and possible computational approaches for investigation. The hierarchical organization of biomolecules is represented by dashed black arrows linking three different levels of biological complexity. Starting from the bottom (pink box), four small units named nucleotides, amino acids, mono/di- saccharides and lipids constitute the building blocks of biomolecules. For nucleic acids and proteins only, the first-synthesized linear polymers are represented on top of nucleotides and amino acids, respectively. The middle box (cyan box) includes the 3D structures of biomolecules. For all biomolecules, an exemplifying 3D spatial organization is reported (PBD structures 1BNA, 6C65 and 4L9K are used as DNA, RNA and protein structure, respectively; for carbohydrates, dextran is reported; finally, a lipid bilayer structure of lipids obtained by molecular dynamics simulation is reported). On top (green box), an exemplifying cell, tissue and human organism, representing the progressive supramolecular organization, are reported. The dashed blue arrows link different biomolecule sources to imaging data sets (purple box), which include a heterogeneous group of big data that can be analysed for biomolecule investigation. Superimposed on the landscape, the red arrows represent the computational approaches dealt with in this review, for which proof-of-concept quantum algorithms have been recently reported. The numbers reported are referred to the human cell and organism.
