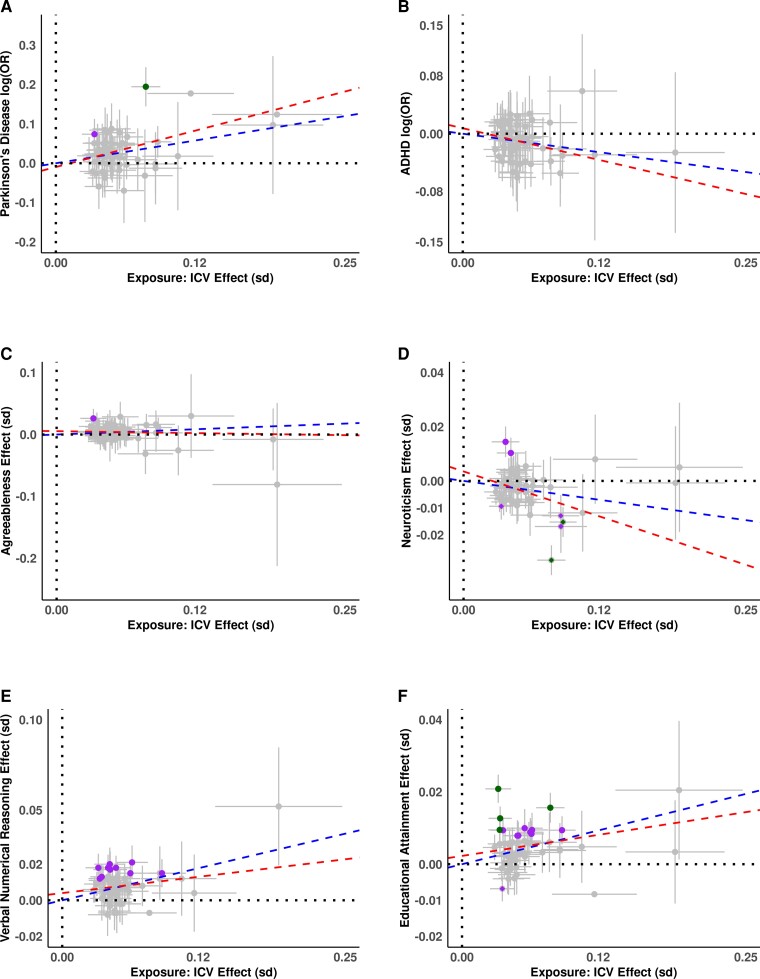
Figure 5.
Effect versus effect plots of top associations from MR analysis. On x-axis are effect size for ICV and on y-axis (not always symmetric around zero) for; (A) Parkinson’s disease as log(odds ratio), (B) ADHD as log(odds ratio), (C) Agreeableness as beta in SD, (D) neuroticism as beta in SD, (E) verbal numerical reasoning as beta in SD and (F) educational attainment as beta in SD. All effects are plotted for alleles with increasing ICV. Blue line represents the estimated slope from IVW (inverse variance weighted regression), and red line is estimated from MR Egger analysis including the intercept. Green dots represent conventional GWAS associations (P < 5.0 × 10⁻⁸) for respective y-axis trait, while purple dots are Bonferroni significant associations (P < 0.05/64 = 7.8 × 10⁻⁴) for respective the y-axis trait. See Supplementary Figs. 33–46 for individual trait plots.

