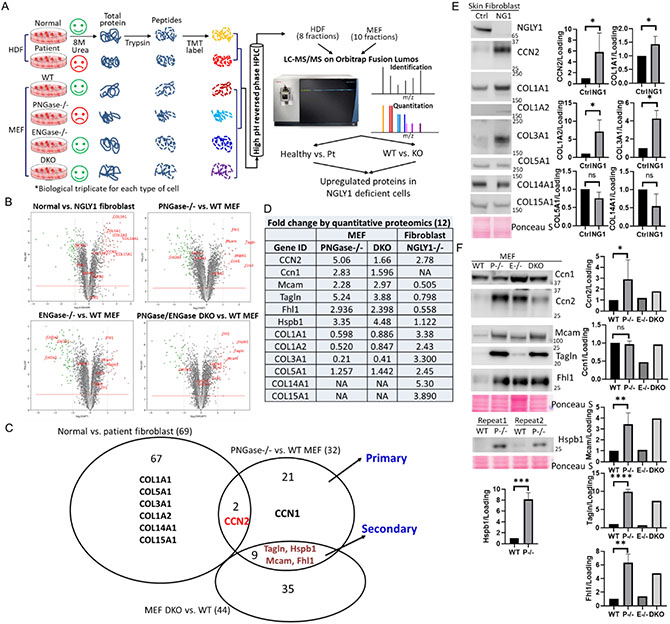
Figure 2. Quantitative proteomic analysis of upregulated proteins in NGLY1-deficient cells.
(A)Flow chart of TMT labeling proteomics. HDF, human dermal fibroblast; Pt, patient with NGLY1 deficiency. (B) Volcano plots demonstrating statistical significance (P value, y axis) versus magnitude of change (fold change, x axis). (C) Venn diagram demonstrating the upregulated proteins between cell lines. (D) Table showing the IDs and fold changes of the selected candidates. (E and F) Protein level change validated by WB analysis. Ponceau S stain was used as loading control. Data with error bars represent means ± SD from at least two independent experiments. Unpaired Student t-test was used to compare means between normal and NGLY1-deficient cells. *P < 0.05, **P < 0.01, ****P < 0.0001.

