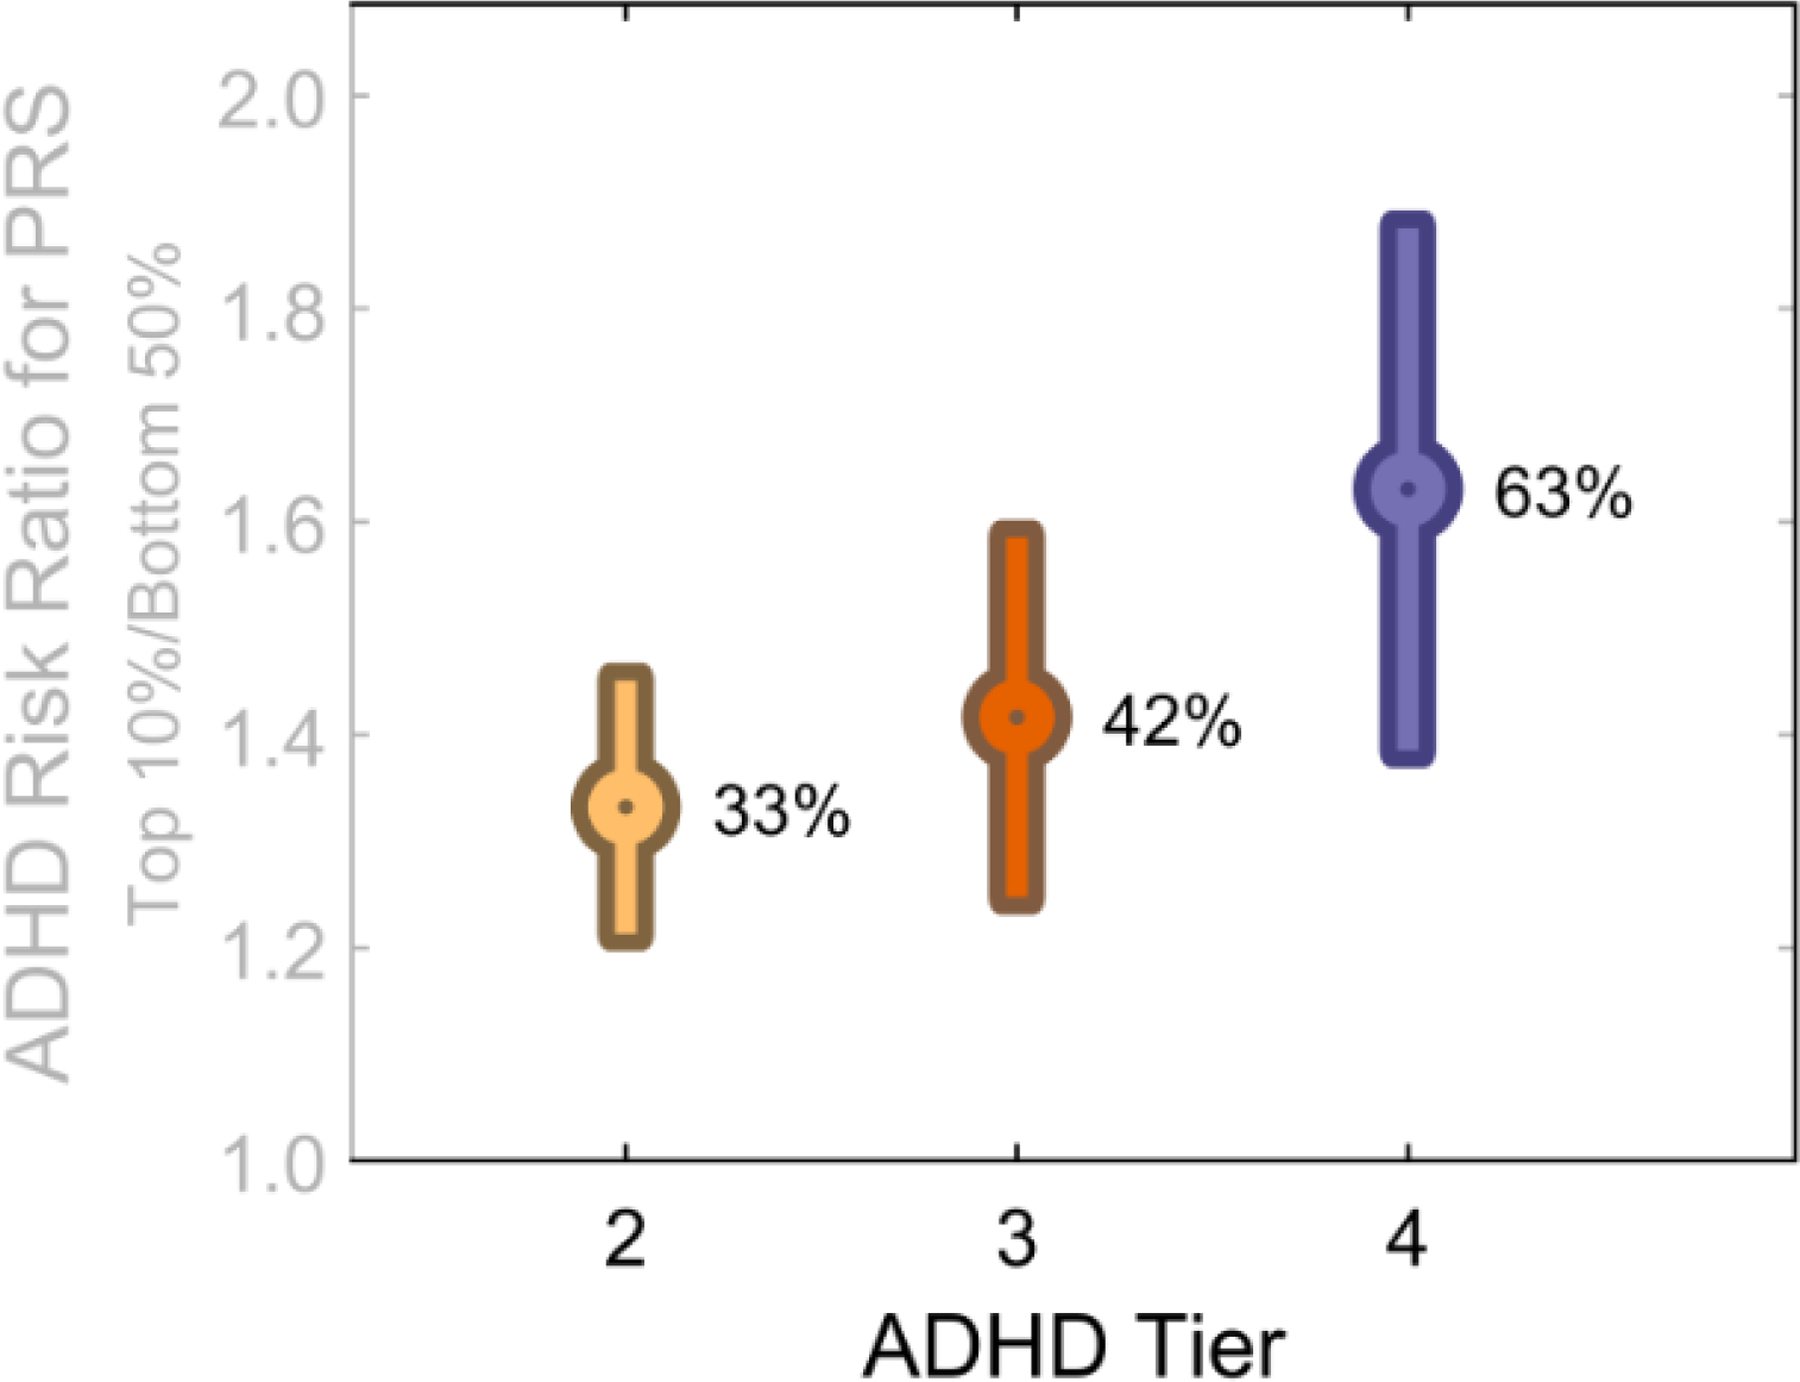
Figure 1. Risk Ratio for ADHD by PRS Score in the Top 10% vs. Bottom 50% of Scores.

Each ADHD tier is increasingly restrictive. The yellow bar represents ADHD Tier 2 (risk ratio and its standard error) that is, the KDADS alone after rule outs; the red bar is Tier 3, (adding BPM.65); the blue bar is ADHD-Tier 4 (adding parent CBCL screen). The figure excludes cases of schizophrenia, bipolar disorder, and intellectual development disorder (hence, excludes “ADHD-1”) for clarity. The percentages represent odds ratios that have been converted to percentage of increased risk. Thus, an OR=1.33 is represented here as 33%. It represents the increased risk of being in the top 10% of PRS scores based on meeting criteria for each ADHD tier versus being in the bottom half of ADHD-PRS scores. ADHD-Tier 2 (KSAD only after rule outs, n = 1029); ADHD-3 (requires teacher BPM T>=65, n = 642); ADHD-4 (also requires parent CBCL attention problems T score >=65; n= 420.) PRS=LD pred polygenic risk for ADHD. Figure demonstrates that the restrictive phenotype more clearly detects polygenic risk.
