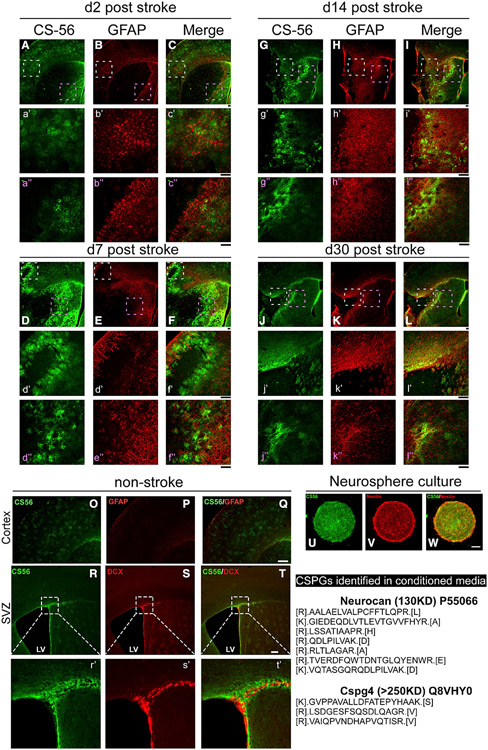
Figure 1. Accumulation of CSPGs near the infarct border at 2–30 days after stroke and NSCs.
(A–L) CSPG staining in stroke brains. Higher magnification (a’–l”). Representative images are shown with >3 mice with similar results for each time point.
(M–R) CSPGs staining in non-stroke brain within the cortex or SVZ niche (higher magnification inp’-r’).
(S–U) CSPGs are present in ex vivo adult SVZ neurospheres. Lower right panel shows CSPGs detected by mass spectrometry in conditioned media from neurosphere cultures (see Table S1 for full list). Scale bar: 50 μm.

