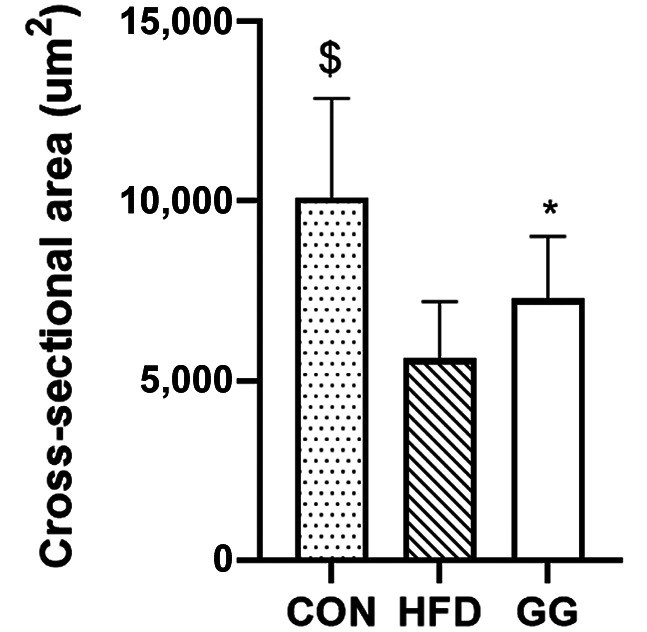
Figure 4. Cross-sectional area (CSA) analyses for soleus muscle of rats. For CSA analysis [regular diet (CON): n=7; high-fat-diet (HFD): n=7; GG: n=7), 100 muscle fibers from each rat (n=700 muscle fibers) were analyzed. A significant condition effect was observed. Values are mean±SE. $p<0.05 vs. GG and HFD groups. *p<0.05 vs. HFD group.

