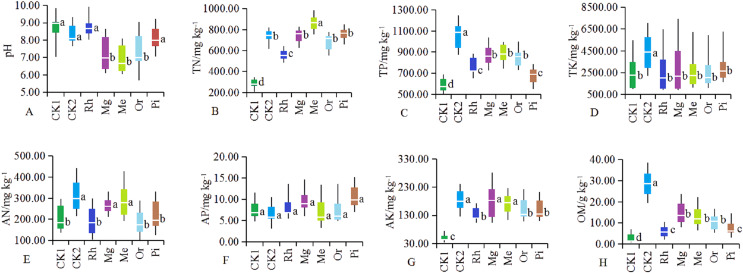
Figure 1. (A–H) Soil physicochemical properties in different sample plots.
The different letters indicated significant differences between treatments according to ANOVA and Tukey’s test (n = 7, P < 0.05). The white line segments in each box indicated the average of the data group. The tops and bottoms of boxes represent the 75th and 25th percentiles, respectively. The upper and lower vertical bars extend to the maximum and minimum values, respectively.

