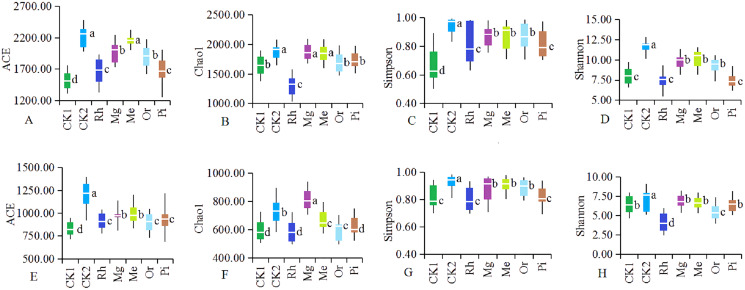
Figure 4. Diversity of the soil bacteria (A–D) and fungi (E–H).
Alpha diversity of the soil bacteria (A–D) and fungi (E–H). The white horizontal bars inside each box indicates the mean value. The tops and bottoms of boxes represent the 75th and 25th percentiles, respectively. The upper and lower vertical bars extend to the maximum and minimum values, respectively. The numbers of replicated samples in this figure are n = 7. Letters are used to distinguish whether there are significant differences between groups. Different letters indicate that there are display differences between groups (P < 0.05).

