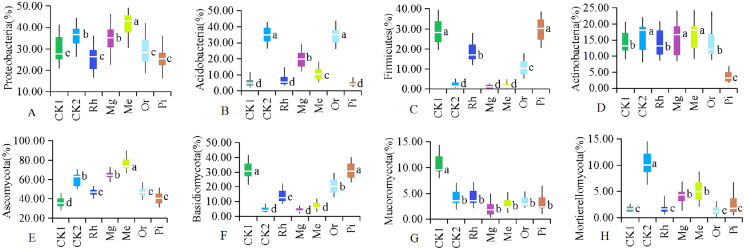
Figure 5. The relative abundances of dominant soil bacterial (A–D) and fungal (E–H).
Communities at the phylum level. Letters are used to distinguish whether there are significant differences between groups. Different letters indicate that there are display differences between groups (P < 0.05, ANOVA).

