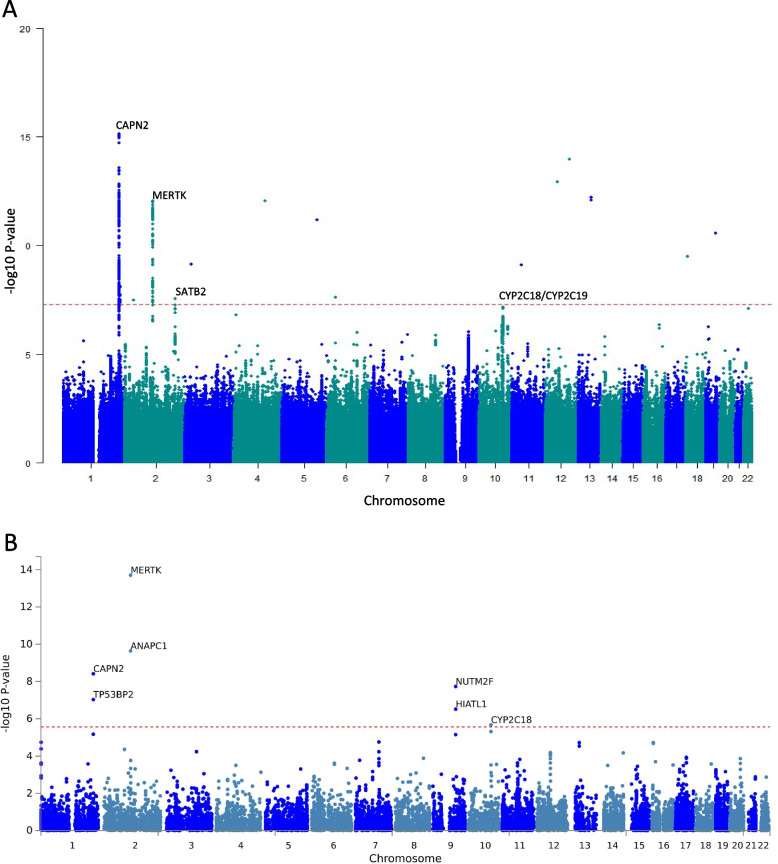
Fig. 1.
Manhattan plots for the GWAS and gene-based analysis. A Manhattan plot for the associations of SNPs with cluster headache. The horizontal axis shows the chromosomal position, and the vertical axis shows the significance of tested markers. The threshold for genome wide significance (p < 5 × 10⁻⁸) is indicated by a red dash line. B Manhattan plot of the gene-based test as computed by Multimarker Analysis of GenoMic Annotation (MAGMA). The input SNPs were mapped to 18,460 protein coding genes. The red dash line indicates the genome wide significance defined at p = 0.05/18,460 = 2.709 × 10⁻⁶

