Figure 5.

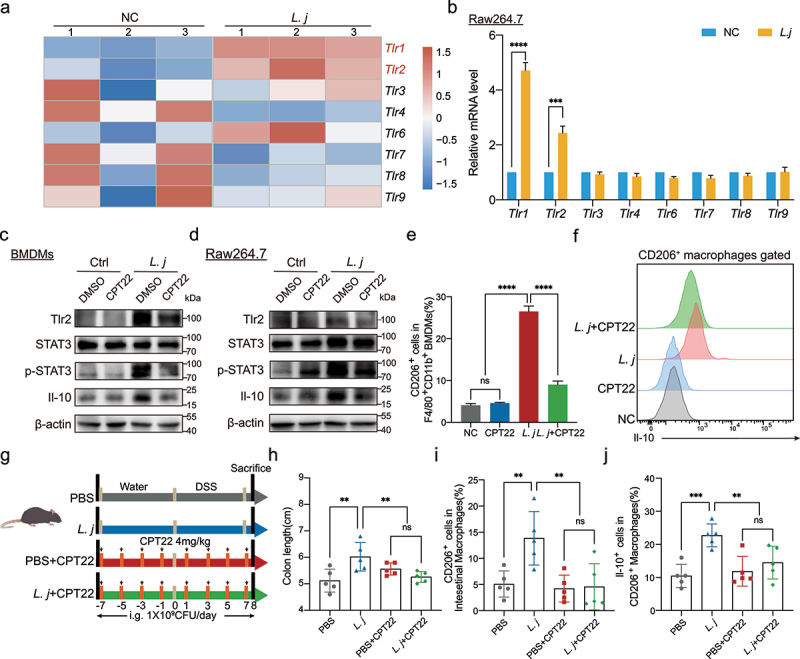
TLR1/2 participated in the recognition of L. johnsonii by CD206+macrophagesIL-10.
a, Heat map representing the TLRs genes expression patterns between L. johnsonii-treated or PBS-treated BMDMs by Microarrays (n = 3 per group, fold change>2, logCPM>2, FDR<0.05). b, The mRNA levels of the TLRs Tlr1, Tlr2, Tlr3, Tlr4, Tlr6, Tlr7, Tlr8 and Tlr9 were evaluated in Raw264.7 cells after L. johnsonii treatment. c-d, The protein expression of Tlr2, STAT3, p-STAT3, Il-10 was tested by western blot in both BMDMs (c) and Raw264.7 cells (d). e, Percentage of CD206+ macrophages were analyzed by flow cytometry after BMDMs co-cultured with PBS control (NC), CPT22, L. johnsonii (L. j) or CPT22 and L. johnsonii (L. j+ CPT22) (MOI = 100:1) for 24 hours. f, Representative histograms of Il-10 expression by CD206+ macrophages were shown after BMDMs co-cultured with PBS control (NC), CPT22, L. johnsonii (L. j) or CPT22 and L. johnsonii (L. j+ CPT22) (MOI = 100:1) for 24 hours. g, Schematic diagram showing that the process of TLR1/2 inhibition model in vivo. h, Colon length was analyzed in four groups. i, Percentage of CD206+ macrophages were analyzed from colon lamina propria in TLR1/2 inhibition model. j, Percentage of Il-10+ cells were analyzed from CD206+ macrophages in TLR1/2 inhibition model. Data are presented as mean ± SD, n = 3–5. **, P < .01; ***, P < .001; ****, P < .0001; ns no significant. unpaired Student’s t test (b), ANOVA test (e, h-j).
