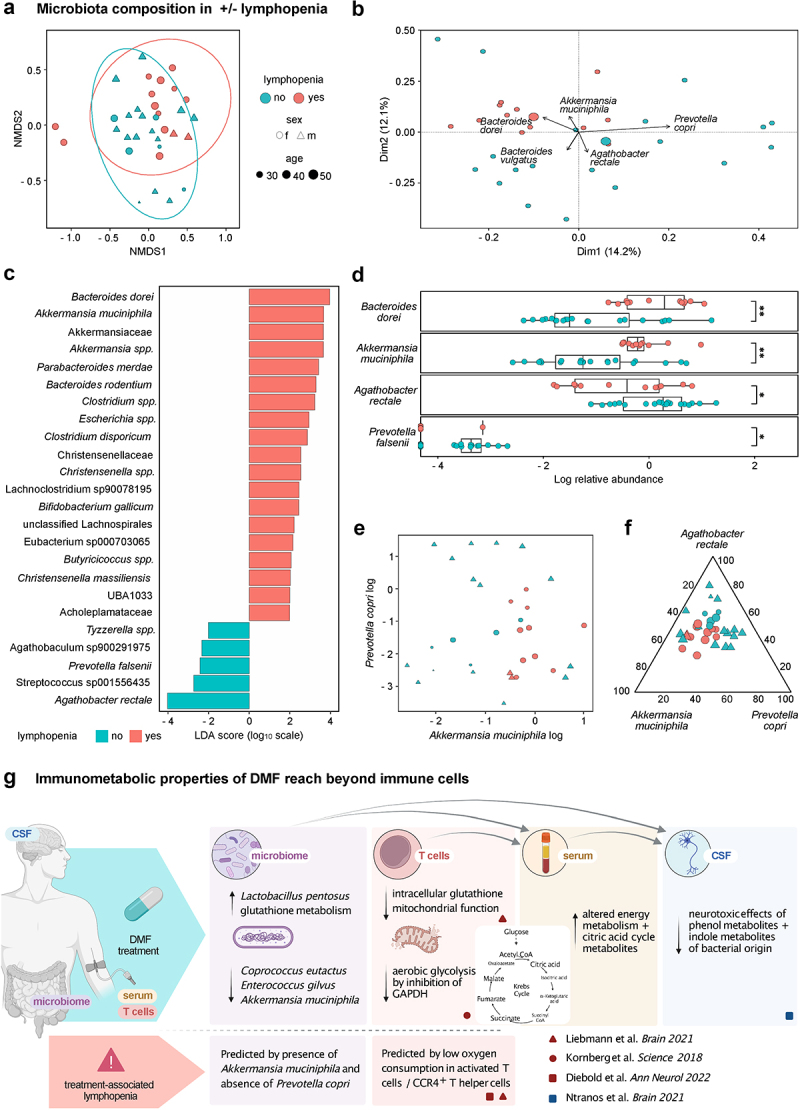
Figure 2.

Microbiota composition predisposes to DMF-associated lymphopenia. (a) Non-metric multidimensional representation (NMDS) of the gastrointestinal microbiota composition of samples from individuals with (red) or without (turquoise) subsequent DMF-associated lymphopenia. Circles represent confidence interval of 95% (stress: 0.17). (b) Principal component analysis of the gastrointestinal microbiota composition of samples from individuals with (red) or without (turquoise) subsequent DMF-associated lymphopenia with Euclidean vectors representing the effects of main microbiota, excluding one individual with dominant streptococcal effect (b–f). (c) LEfSe analysis of dominant gastrointestinal microbiota of individuals with (right) and without (left) subsequent DMF-associated lymphopenia. Colored bars indicate taxa highlighted in adjunct figures. (d) Box plots of log10-transformed normalized relative abundances of four most affected (according to principal component analysis, 2B, and LEfSe analysis, 2C) microbial species in samples with (red) or without (turquoise) subsequent DMF-associated lymphopenia. (e) Bi-axial dot plot of log10-transformed relative abundances of Akkermansia muciniphila and Prevotella copri, color code indicating samples with (red) or without (turquoise) subsequent DMF-associated lymphopenia. (f) Ternary dot plot of the log10-transformed and subsequently normalized abundances of A. muciniphila, Agathobacter rectale, and P. copri only, color code indicating samples with (red) or without (turquoise) subsequent DMF-associated lymphopenia. (g) Graphical summary of findings from this study and the recent literature.
