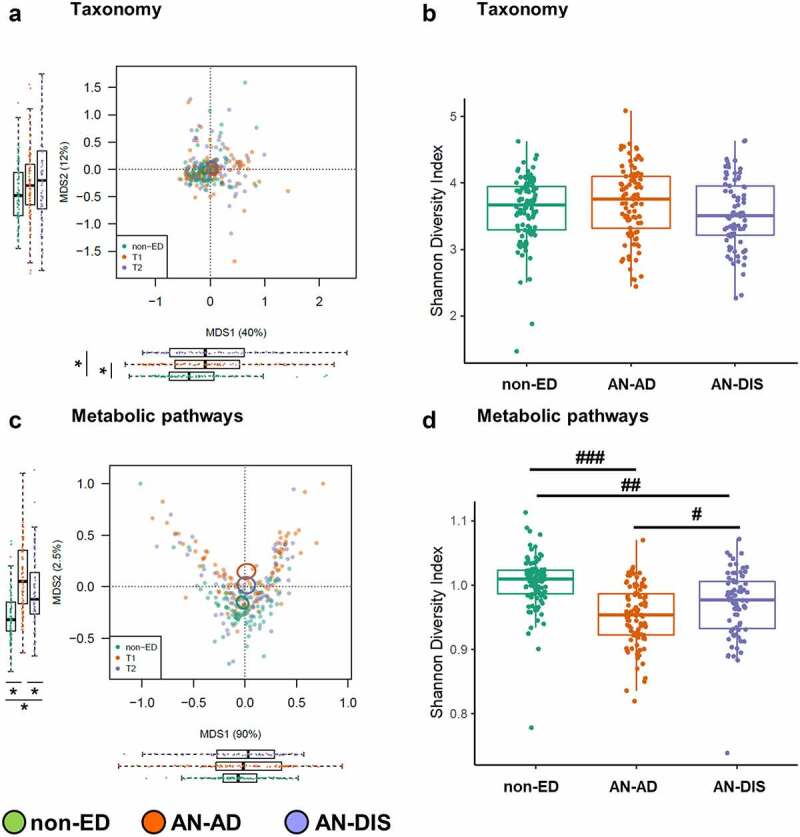
Figure 2.

Patients with AN exhibit distinct gut microbiomes, before and following inpatient treatment, compared to non-ED controls. Principal Coordinates Analysis plot using Bray–Curtis distances (a) and Shannon diversity (b) based on species-level taxonomies. Principal Coordinates Analysis plot using Bray–Curtis distances (c) and Shannon diversity (d) based on metabolic pathways. Boxplots adjacent to each plot show the first and second axes (MDS1 and MDS2) for non-ED and AN (AD and DIS) gut microbiomes. Tests: unpaired t-test for non-ED versus AN (AD and DIS), paired t-test for AD versus DIS. ###p = 5.2 × 10⁻¹³, ##p = 9.39 × 10⁻⁶, #p = .004, *p < .05.
