
Extended Data Fig. 11 |. Cryo-EM data processing for M22-bound TSHR-Gs complex.
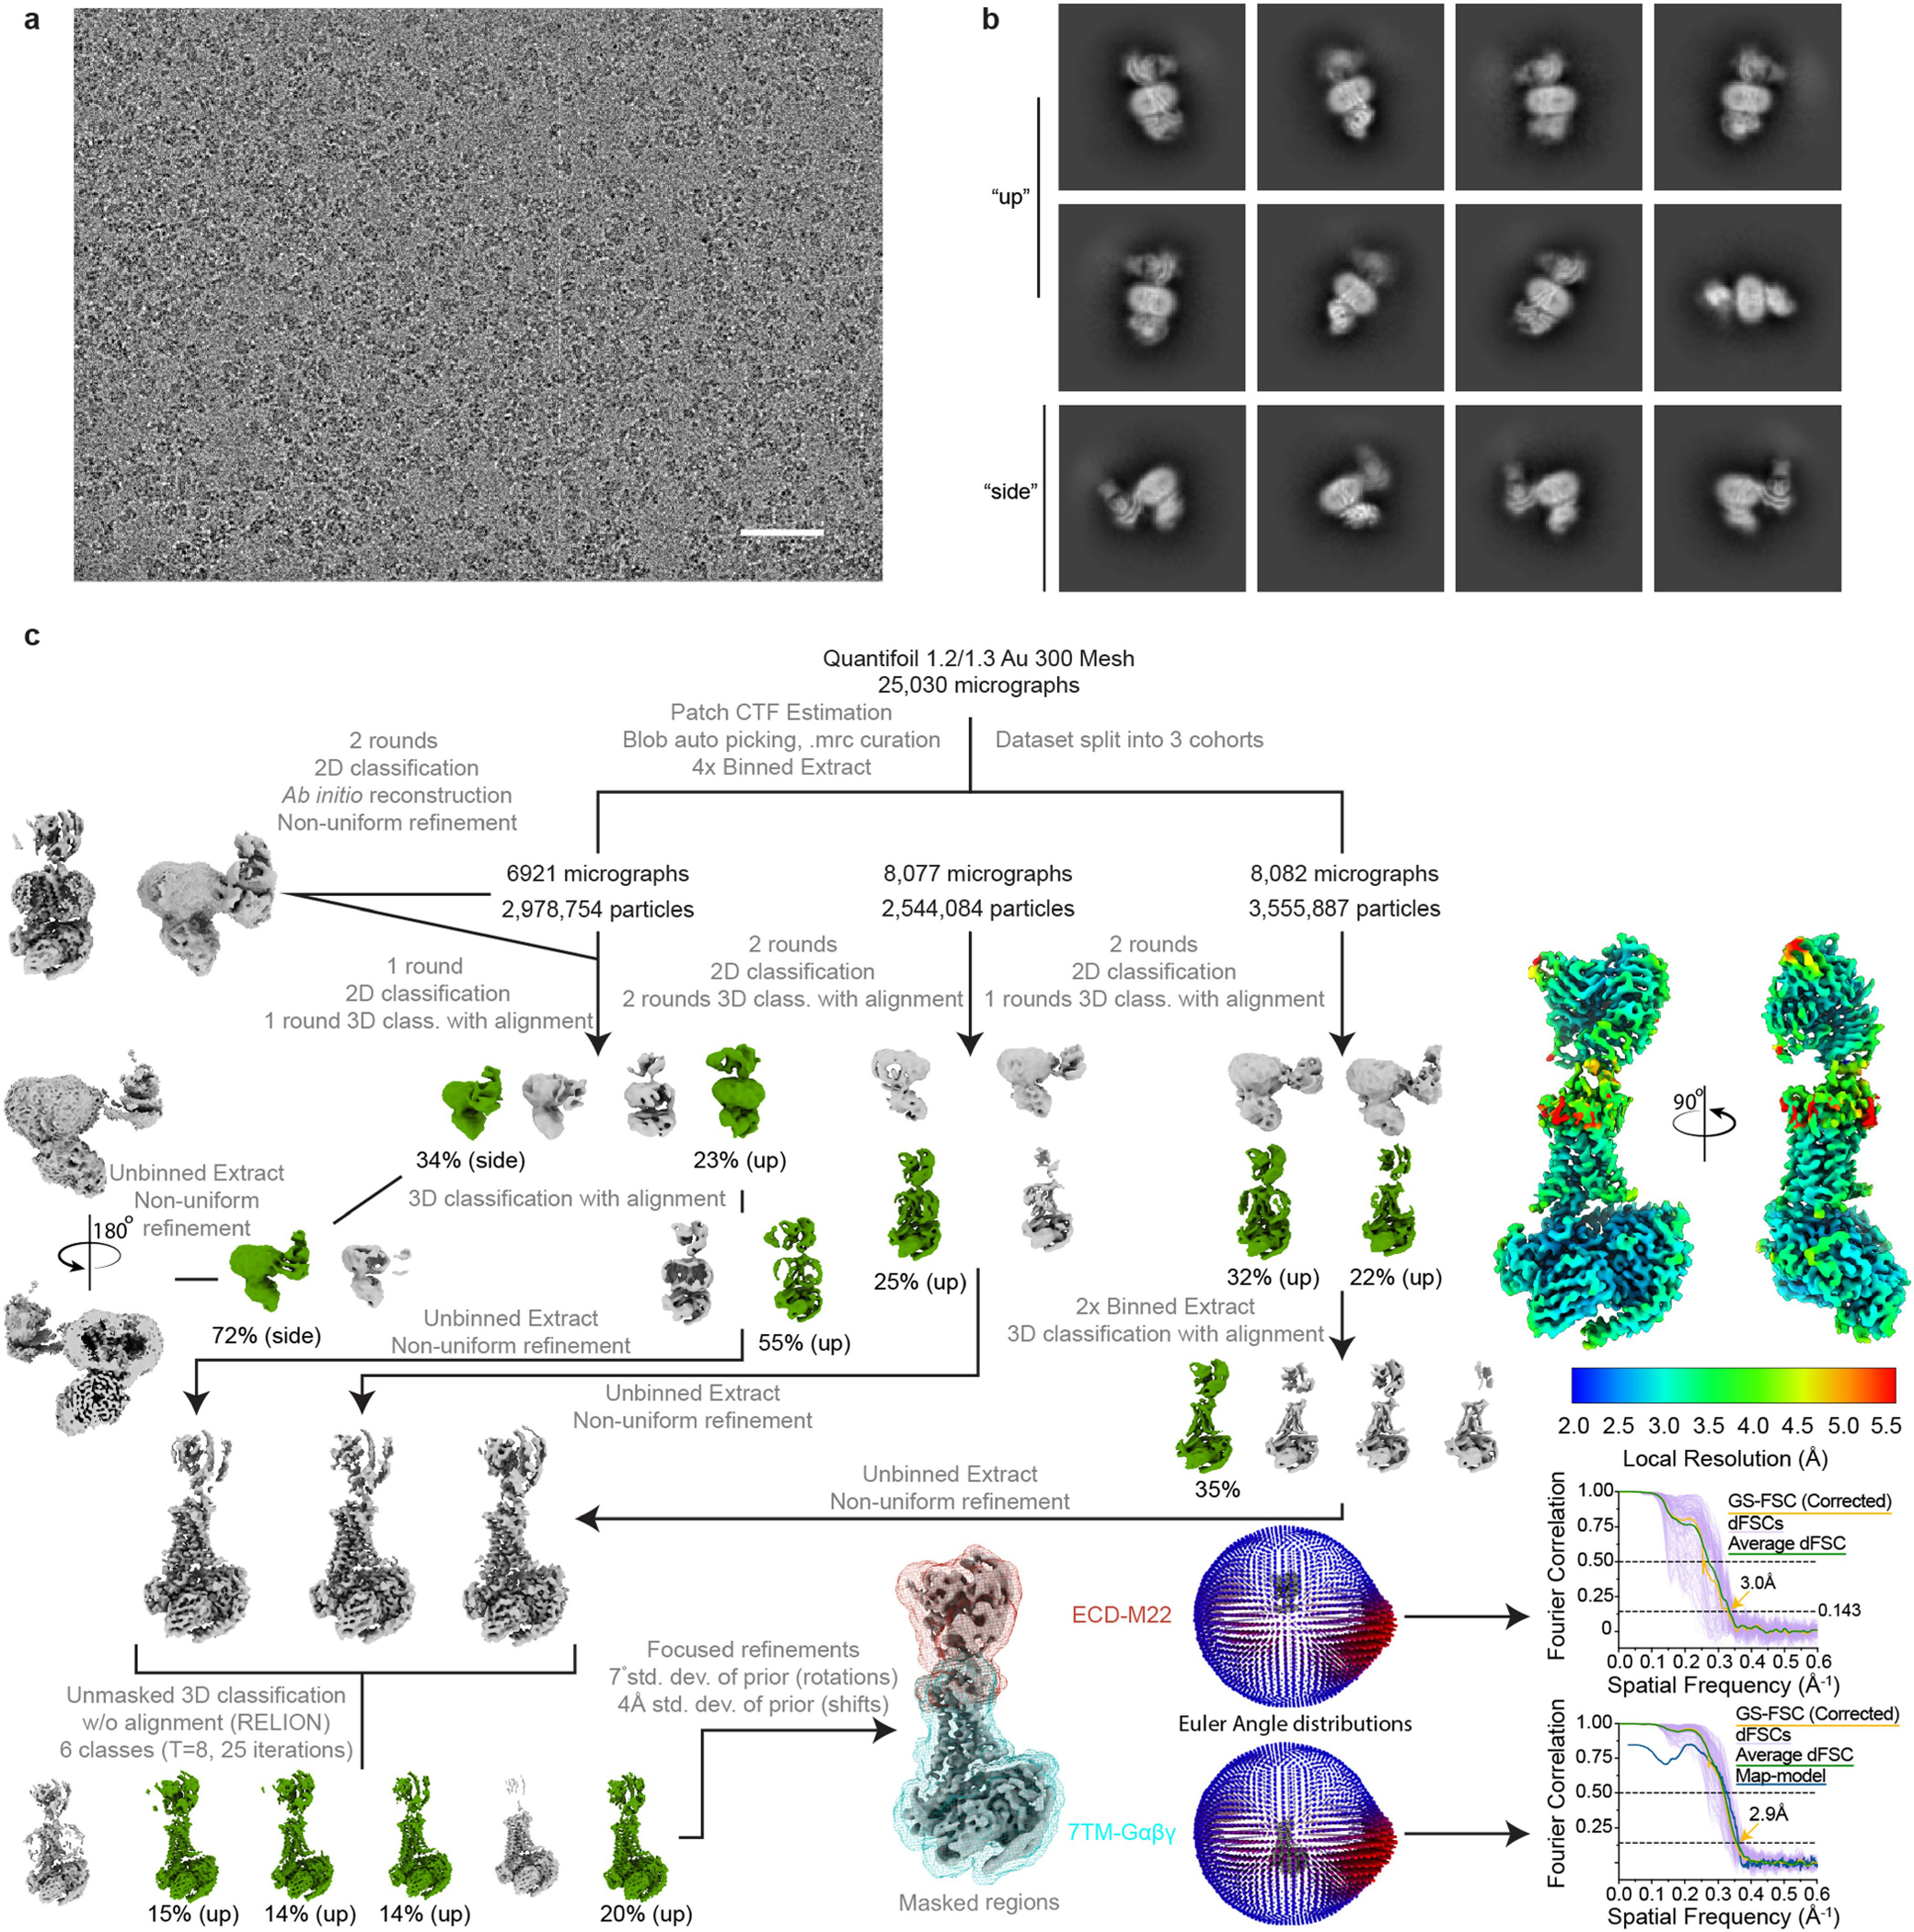
a) Representative image from 25,030 micrographs. Scale bar, 50 nm. b) Selected 2D class averages from final reconstruction. c) Processing approach used for reconstruction of M22-bound TSHR-Gs complex. A local resolution map was calculated from cryoSPARC using masks from indicated local refinement, then visualized with the composite map in the same scale. A viewing distribution plot was generated using scripts from the pyEM software suite and visualized in ChimeraX. GS-FSC and dFSC curves were generated in cryoSPARC and as previously described in Dang, S. et al. Nature 552, 426–j429 (2017).