
FIGURE 2.
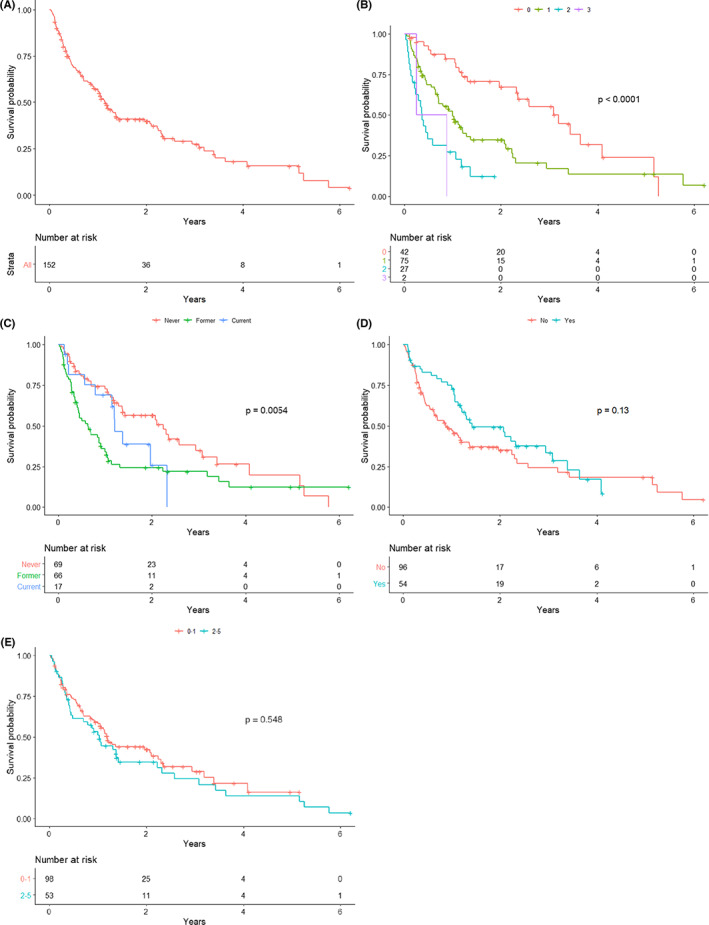
OS in all patients (2A; top left); OS by ECOG PS (2B; top right); OS by smoking status (2C; middle left); OS by viral vs. nonvirally associated disease (2D; middle right); OS by number of prior lines of therapy (2E; bottom)
Official websites use .gov
A
.gov website belongs to an official
government organization in the United States.
Secure .gov websites use HTTPS
A lock (
) or https:// means you've safely
connected to the .gov website. Share sensitive
information only on official, secure websites.
OS in all patients (2A; top left); OS by ECOG PS (2B; top right); OS by smoking status (2C; middle left); OS by viral vs. nonvirally associated disease (2D; middle right); OS by number of prior lines of therapy (2E; bottom)