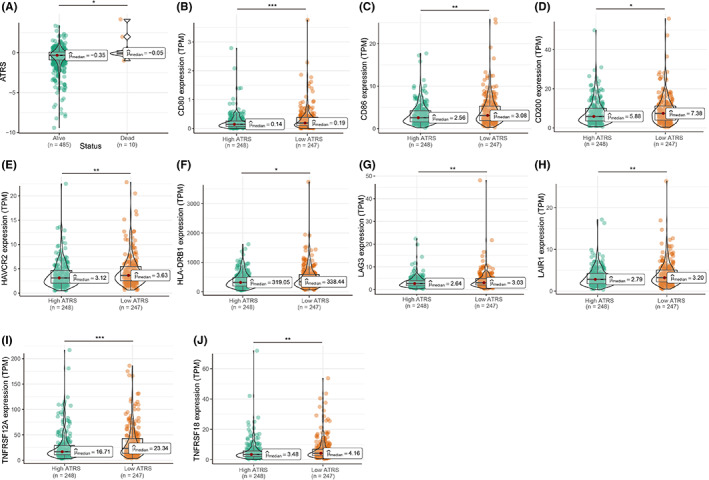
FIGURE 8.

The correlation of ATRS with the expression levels of immune checkpoints. PCa patients with alive status had lower ATRS than dead patients (A), and patients with high ATRS had lower expression levels of CD80, CD86, CD200, HAVCR2, HLA‐DRB1, LAG3, LAIR1, TNFRSF12A, and TNFRSF18 (B–J)
