FIGURE 3.

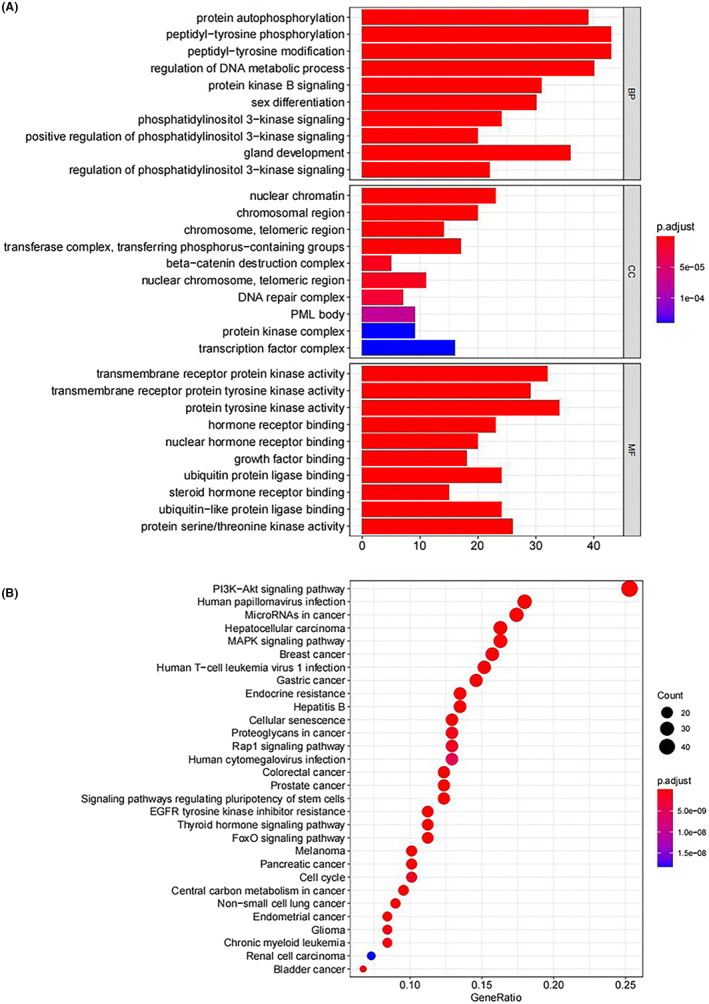
GO enrichment histogram. The abscissa is the number of core genes enriched in the GO analysis, the ordinate is the enriched GO, and the color represents the statistical significance

GO enrichment histogram. The abscissa is the number of core genes enriched in the GO analysis, the ordinate is the enriched GO, and the color represents the statistical significance