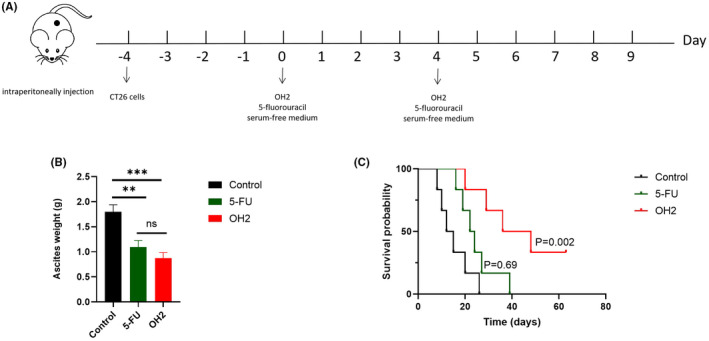
FIGURE 2.

OH2 inhibited ascites production and prolonged survival time. (A) The schema of treatment protocol; (B) OH2 inhibited ascites production in mouse ascites weight on day 9 since the first treatment; (C) Kaplan–Meier curves of overall survival time in different groups. Ascites weight: mean ± SEM; one‐way ANOVA (p > 0.05, ns; *p < 0.05; **p < 0.01; ***p < 0.001)
