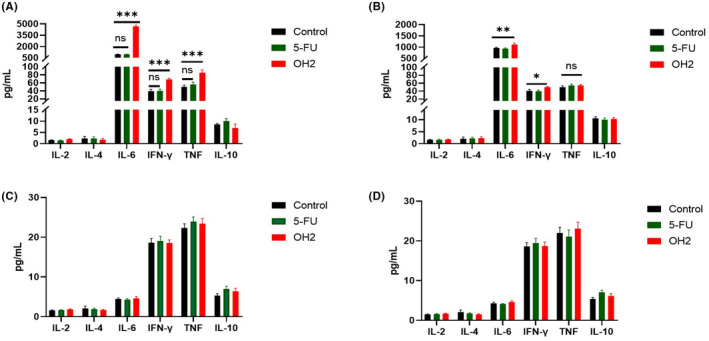
FIGURE 3.

The levels of six cytokines between the OH2 group and the other control group from ascites and serums. (A) the cytokine levels of ascites on day 4 since the first treatment; (B) the cytokine levels of ascites on day 9 since the first treatment; (C) the cytokine levels of serums on day 4 since the first treatment; (D) the cytokine levels of serums on day 9 since the first treatment
