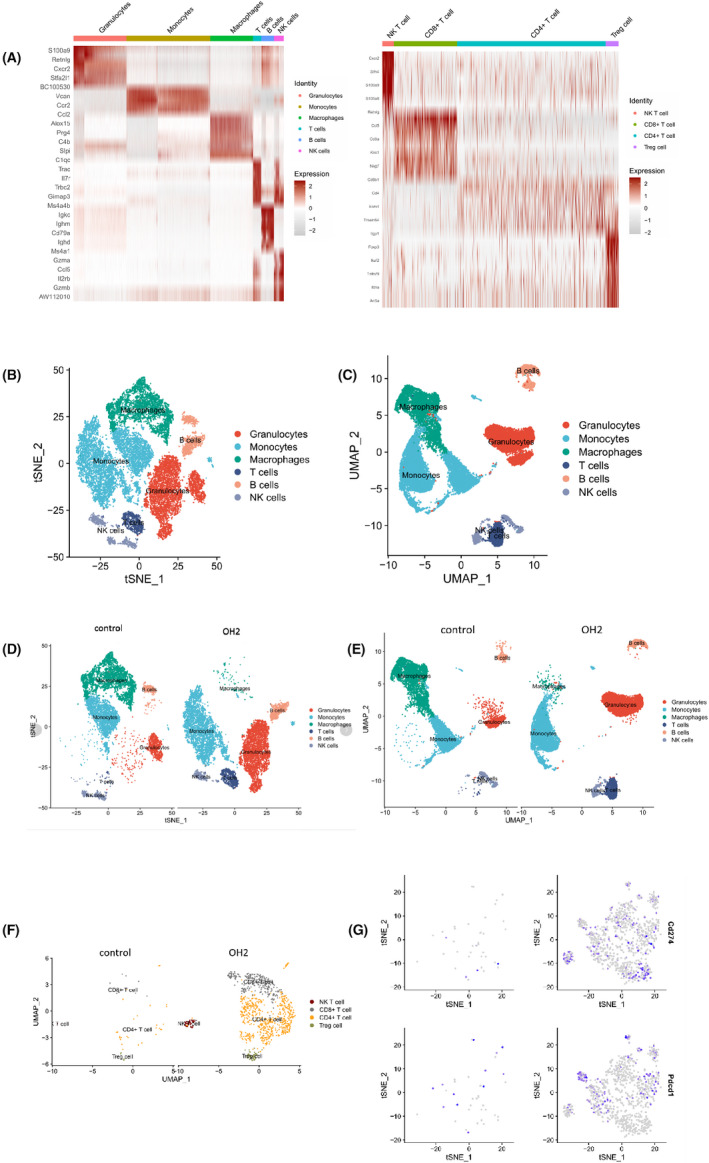
FIGURE 5.

Characterization of T cell subtypes stimulated by Oncolytic OH2 in ascites. (A) Based on the marker genes, we defined each cell group. Red showed for high expression. (B) Each of the T cell clusters was identified by marker genes. Red showed high expression from 15,139 cells and 15,546 cells in the control and OH2 groups, respectively. (C, D) Based on the marker genes, we defined a total of six cell groups through tSNE and UMAP. (E, F) Histogram tSNE and UMAP showing T cells group (dark blue) were stronger upregulated in OH2 compared with the control group. (G) Orange and black plots show both CD4+ and CD8+ T cells involved in OH2 and control groups, respectively. (H) Representative gene expressions of Cd274 and Pdcd1 in T cell were stronger upregulated in OH2 compared with the control group
