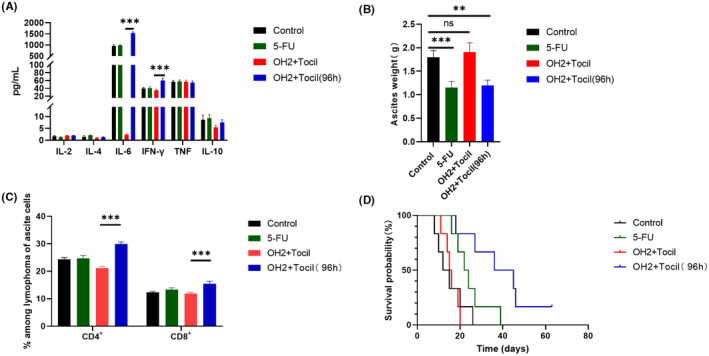
FIGURE 6.

Blocking the IL‐6 signaling pathway by tocilizumab‐downregulated OH2 activity. (A) The levels of six cytokines between the OH2 group and the other control groups (simultaneous tocilizumab exposure); (B) OH2 inhibited ascites production in mice; (C) OH2 increased numbers of CD4+ and CD8+ T cells in murine ascites on day 9 (simultaneous tocilizumab exposure); (D) Kaplan–Meier curve for overall survival
