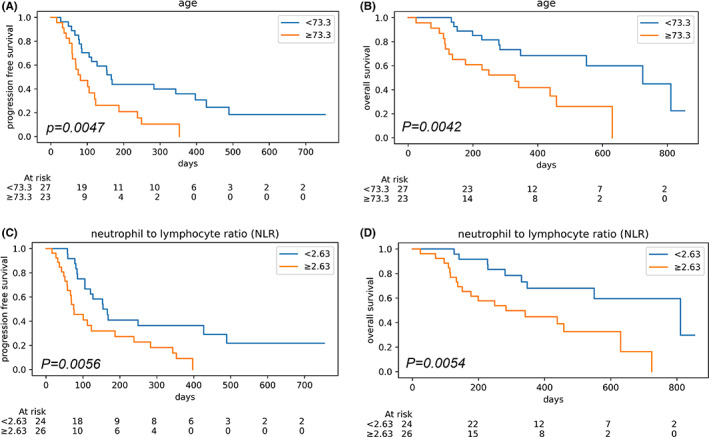
FIGURE 3.

(A) Kaplan–Meier curves for progressive free survival in two groups with younger and older age. (B) Kaplan–Meier curves for overall survival in two groups with younger and older age. (C) Kaplan–Meier curves for progressive free survival in two groups with low and high neutrophil‐to‐lymphocyte ratios. (D) Kaplan–Meier curves for overall survival in two groups with low and high neutrophil‐to‐lymphocyte ratios
