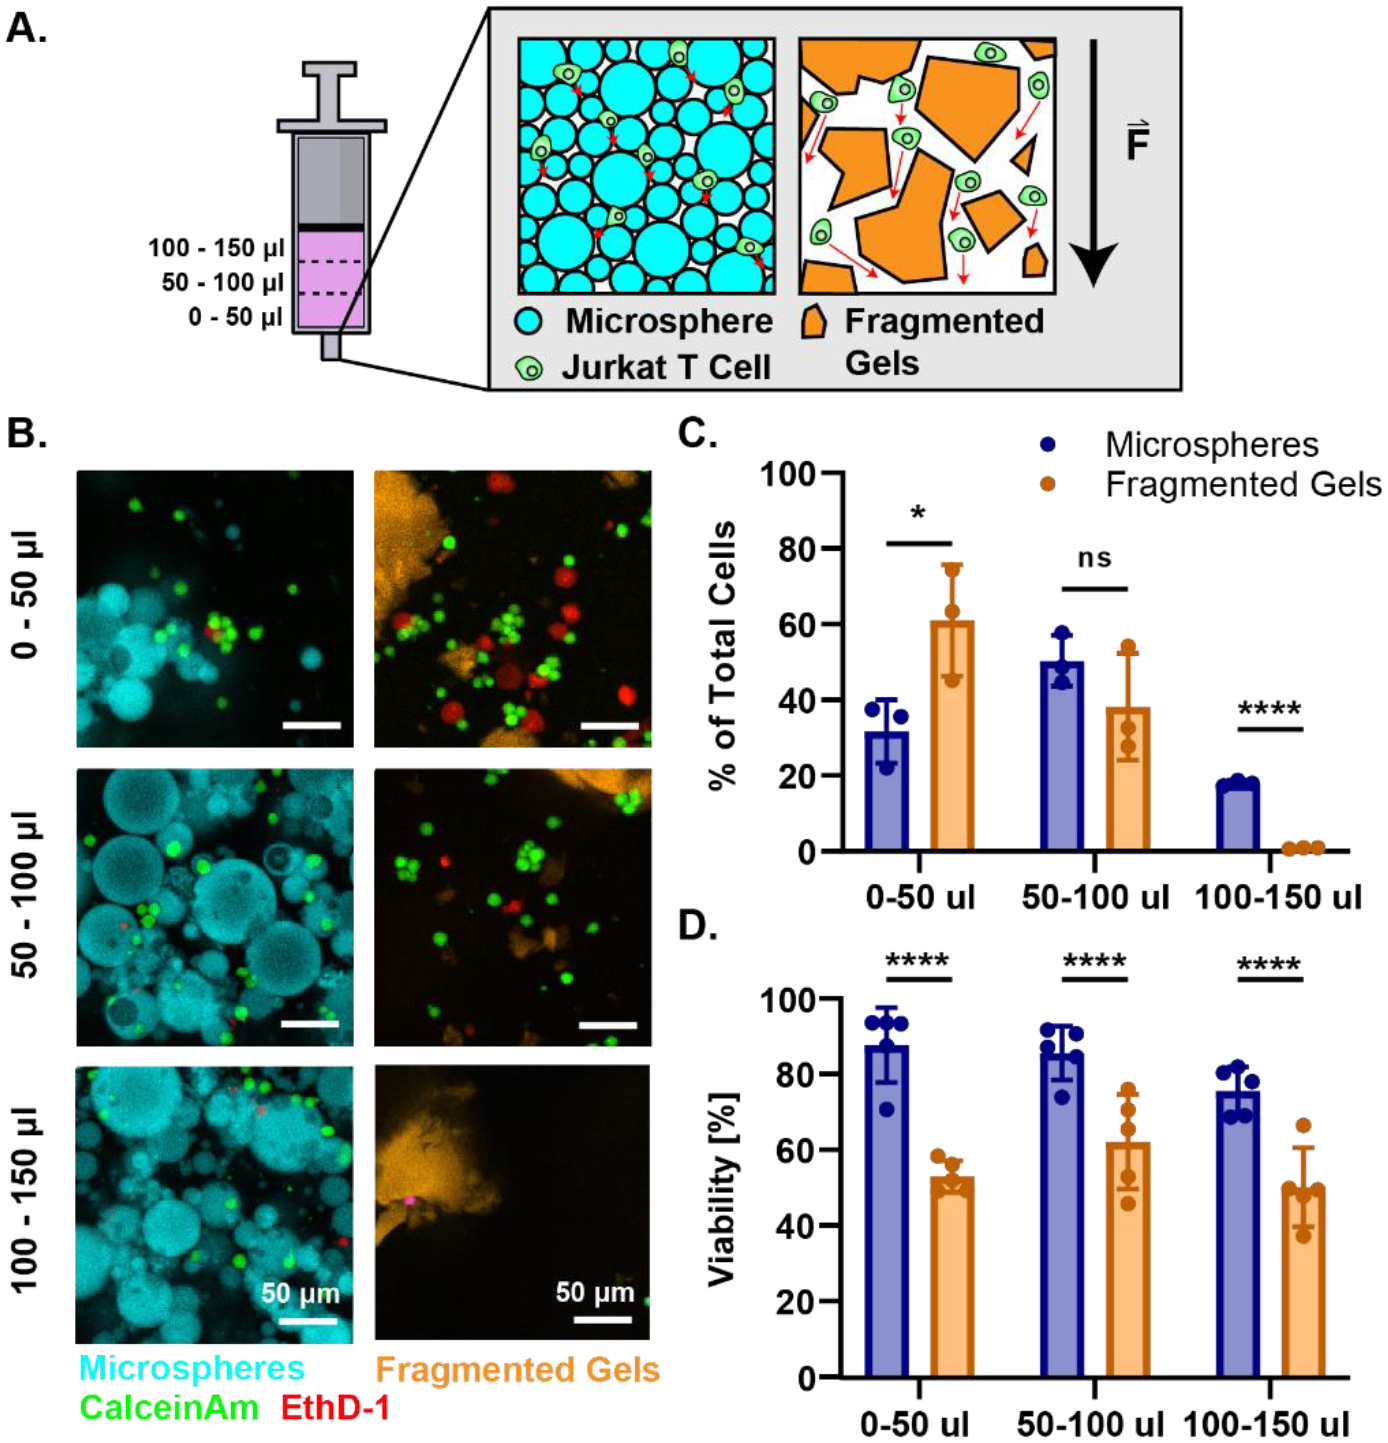
Figure 5.

Distribution and Viability of Cells injected within Granular Hydrogels. (A) Graphical representation of experiment. Syringes were loaded with microspheres or fragmented gels loaded with Jurkat T Cells and injected into a dish. The injection was partitioned into 50 μl volumes for a total of 150 μl and each eluted fraction was imaged to quantify the distribution of cells and microgels. Graphical representations granular convection of cells and MAP scaffold as force is being applied during injection. The cells within the microspheres have shorter elution paths (represented by red arrow) due to compaction of microspheres than cells within the fragmented gels. The cells within the fragmented gels have more space to elute around the gels due to the larger sizes of the particles. The black arrow represents the force applied during the injection. (B) Confocal images of the injection fractions. In the first 50 μl of injection the cells elute around the microspheres and fragmented gels. During the next 50 μl (50–100) the microspheres yield and contain the cells in the interstitial spaces between the gels. In the last 100–150 μl the fragmented gels begin to flow but lack cells as most have moved past the large particles in the first 100 μl of injection. (C) Quantification of the percent of total cells per μl of injection for microspheres and fragmented gels in each fraction of the injection. (D) Percent viability of total cells injected in each stage of injection. For all panels, significance was determined by two-tailed student’s t-tests between the microsphere and fragmented group at each stage of the injection. * = p < 0.05, ** = p < 0.01, *** = p < 0.001, **** = p < 0.0001.
