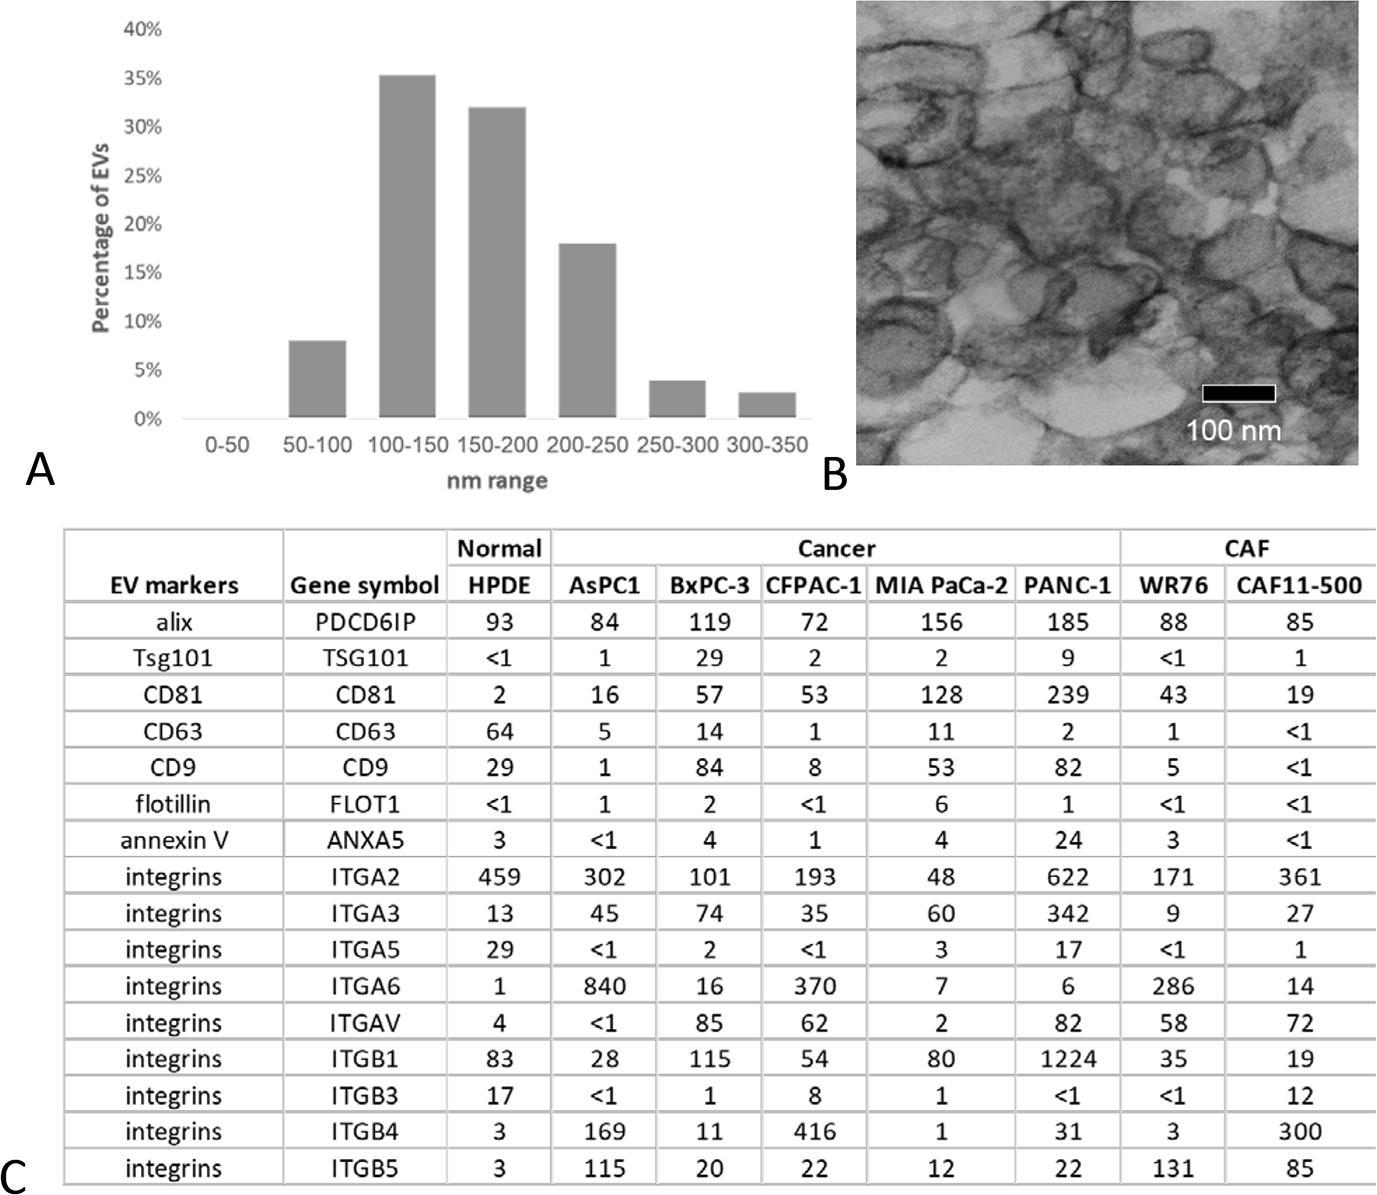
FIGURE 1.

Characterization of enriched EVs. A, Histogram of the size distribution of EVs using analysis of images taken with electron microscopy (n = 150). B, Representative image from electron microscopy of EV enriched sample. The bar indicates 100 nm. C, Expression of common EV markers in the enriched EV samples based on proteomic data. The number presented in the table were the normalized intensity of the protein (IPM).
