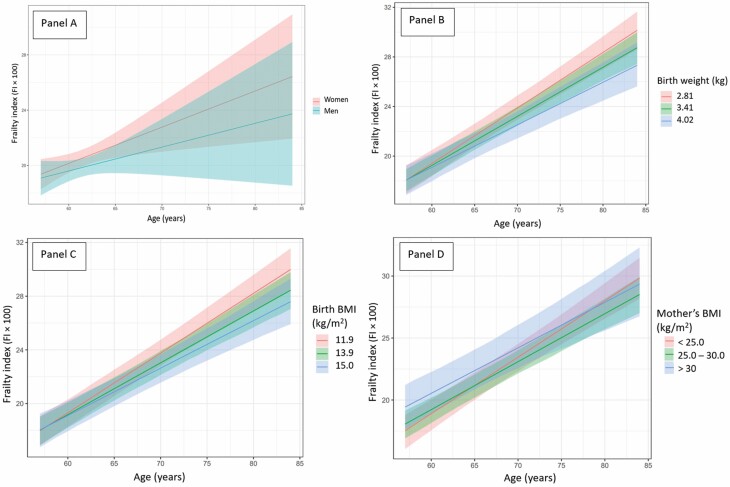
Figure 2.
(Panels A–D) Mean frailty index levels (FI × 100) and as a function of age in the Helsinki Birth Cohort Study: shown (A) separately for men and women, (B) according to quantiles 0.1, 0.5, and 0.9 of birth weight which correspond to values 2.81, 3.41, and 4.02 kg of birth weight, (C) according to quantiles 0.1, 0.5, and 0.9 of body mass index (BMI) at birth which correspond to values 11.9, 13.9, and 15.0 kg/m2 of BMI at birth, (D) according to groups of maternal BMI (<25.0, ≥25.0 and ≤30.0, >30.0 kg/m2).

