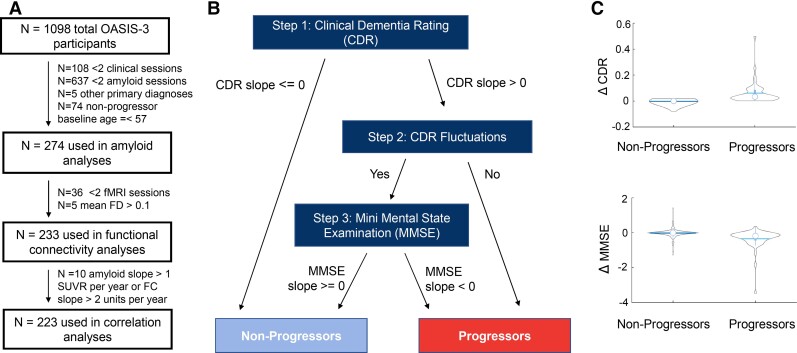
Figure 1.
Classification of participants by progression group. (A) Participants had at least two repeated measures of CDR and MMSE and two PET scans. Participants with primary diagnoses such as Parkinson’s disease were also excluded since we aimed to include participants with very mild cognitive impairment of the Alzheimer’s type. Non-progressors who were younger than 57 years of age at baseline were excluded in order to ensure the progressor and non-progressor groups were age-matched. For the correlation analyses of FC and amyloid levels, we excluded 10 outliers (>5 SD from the mean). The extreme slopes of these outliers are attributed to these participants being scanned at two timepoints very close together (less than a month apart) with different amyloid PET tracers. (B) Progressors versus non-progressors were first classified according to the slopes of their CDR scores. For those with increasing CDR slopes, we examined whether the CDR scores fluctuated (please see Supplementary Information for more details). If a participant's score fluctuated more than once, downward MMSE slopes (<0) were used to confirm cognitive decline. Participants with non-increasing CDR scores or unstable fluctuations of CDR scores were classified as non-progressors. (C) One-way ANOVA tests showed that CDR and MMSE slopes were significantly different between progressors (n = 48) and non-progressors (n = 226) (F = 123.27, P = 8.45E-20 and F = 40.78, P = 7.51E-10 for CDR and MMSE slopes, respectively).

