Figure 2.
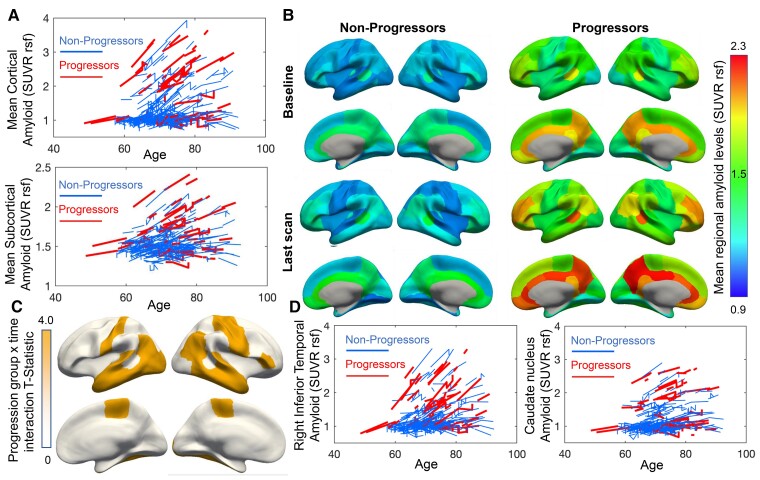
Higher amyloid levels and faster amyloid deposition in progressors versus non-progressors. (A) Spaghetti plots of the linear mixed effect model-fitted amyloid SUVR levels show higher mean cortical and subcortical amyloid SUVR levels in progressors compared with non-progressors. Accumulation rates for mean cortical and subcortical amyloid levels did not differ significantly between groups. (B) Mean model-fitted amyloid values are shown in each of the 68 cortical regions from the Desikan–Killiany atlas. (C) Visualized statistically significant (false discovery rate-corrected P < 0.05) regions for a progression group × time interaction. (D) Compared with non-progressors, progressors show steeper slopes of amyloid accumulation in the right inferior temporal gyrus but not in the caudate nucleus as example regions.

