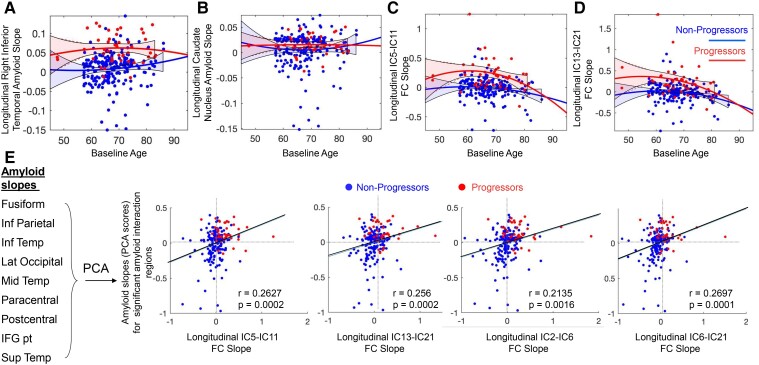
Figure 4.
Correlation between longitudinal changes in amyloid accumulation and FC. Quadratic trajectories and 90% confidence intervals (calculated using MATLAB’s polyconf function) are shown in A-D. We excluded 15 amyloid slopes that were derived from participants with very short follow-up duration and deviated >4 standard deviations from the mean of all amyloid slopes. Amyloid deposition slopes (derived from model-fitted values as described in the Materials and methods) were higher in progressors than non-progressors in the right inferior temporal lobe (A) but not in the caudate nucleus (B). FC slopes (derived from model-fitted values) are plotted against baseline age for two example connectivities between IC-5 and IC-11 (FPN-motor network, C) and IC-13 and IC-21 (DMN-FP/DMN, D), respectively. (E) Visualized correlations between FC slopes and amyloid PCA scores for regions with statistically significant progression group x time interactions.

