
Fig. 1 |. The metabolic route for aspartate synthesis in hypoxic pancreatic cancer cells.
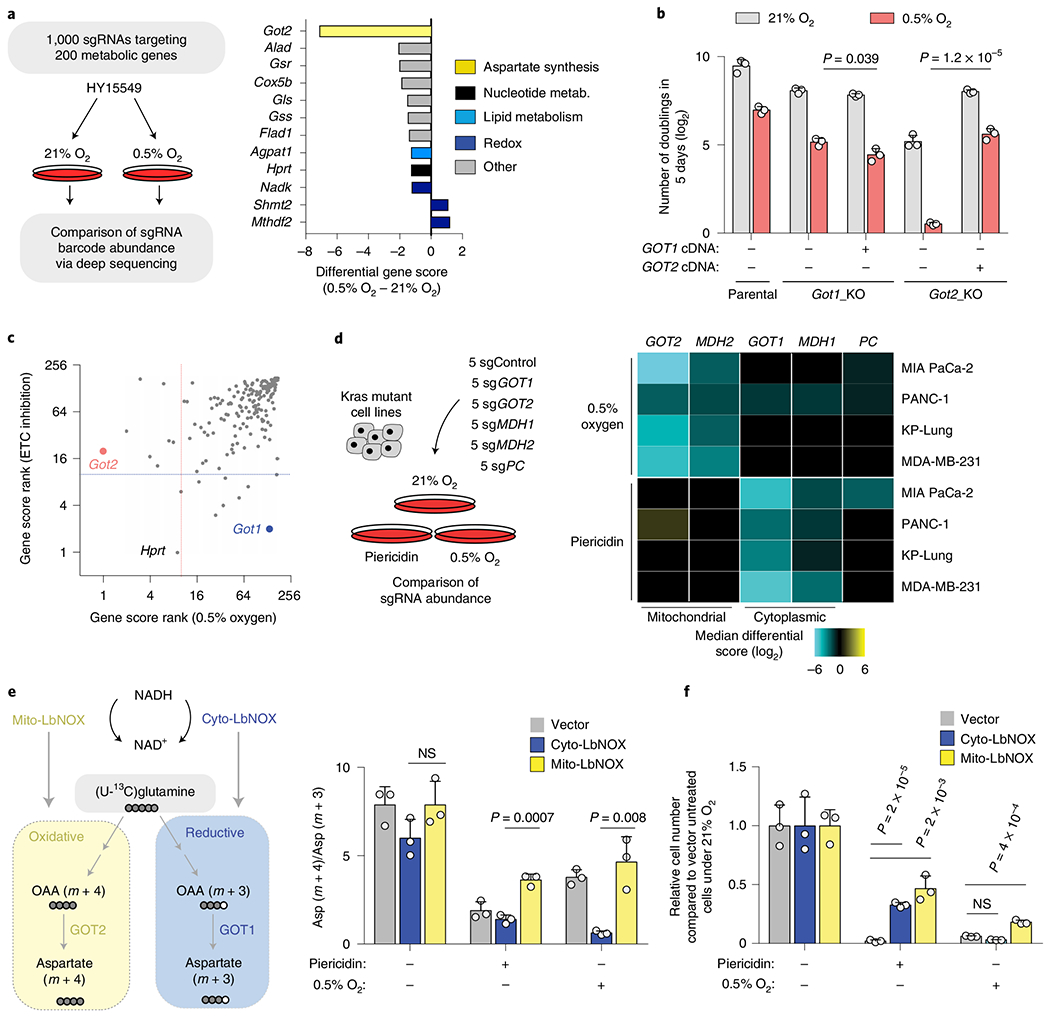
a, Scheme of the focused CRISPR–Cas9 based genetic screen in a Ras mutant mouse PDAC line (HY15549) grown under normoxic (21% O2) or hypoxic conditions (0.5% O2) for 14 population doublings (left). Top scoring genes and their differential gene scores in the focused CRISPR screen (right). b, Number of doublings (log2) of indicated parental, Got1 and Got2-knockout HY15549 cell lines expressing sgRNA-resistant GOT1 or GOT2 cDNA and grown for 5 days under normoxic (21% O2) or hypoxic conditions (0.5% O2). c, Plot of gene score ranks of hypoxia and ETC inhibitor CRISPR screens in HY15549 cells. d, Scheme of the in vitro sgRNA competition assay performed in KRAS-mutant cancer cell lines transduced with a pool of five control sgRNAs (sgControl) and sgRNAs targeting five enzymes involved in aspartate metabolism (GOT1, GOT2, MDH1, MDH2 and PC) (left). Heat map showing median differential gene scores in the indicated cell lines on low oxygen (0.5% O2) or treatment with piericidin, an ETC inhibitor (right). e, Scheme depicting the oxidative (yellow) and reductive (blue) routes from which aspartate can be synthesized from glutamine, and the activation of each pathway by mito- and cyto-LbNOX enzymes. Filled circles represent 13C atoms derived from [U-13C]-l-glutamine (left). Oxidative (m + 4) to reductive (m + 3) aspartate ratio in HY15549 cell lines grown under 21% O2, 0.5% O2 or in the presence of piericidin (50 nM) (right). f, Relative fold change in cell number in HY15549 cell lines transduced with a vector control, cyto-LbNOX or mito-LbNOX grown for 5 days under 0.5% O2 or in the presence of piericidin (50 nM). b,e,f, Bars represent mean±s.d.; b,d,e,f, n = 3 biologically independent samples. Statistical significance was determined by a two-tailed unpaired t-test. NS, not significant.