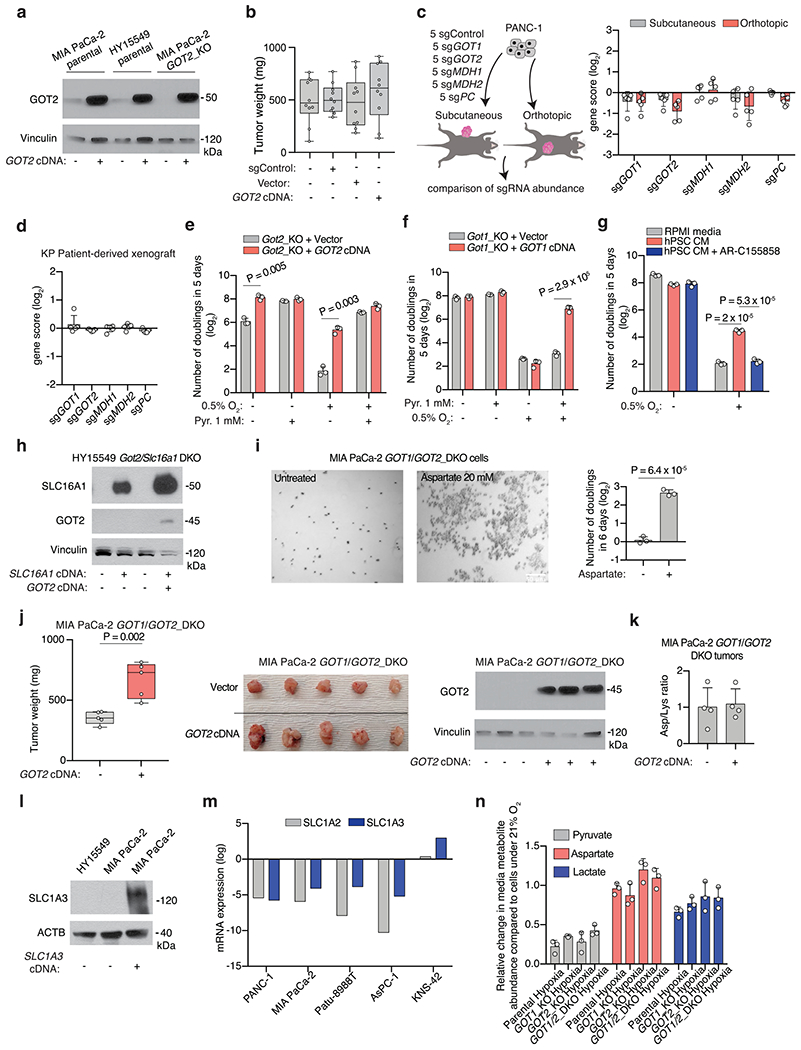
Extended Data Fig. 3 |. Aspartate synthesis by GOTs is essential in culture but redundant for in vivo tumor growth.

(a) Immunoblot analysis of indicated proteins and cell lines with vinculin loading control. (b) Weights of subcutaneous tumor xenografts from MIA PaCa-2 cells transduced with indicated vectors. (c) In vivo sgRNA competition assay scheme (left). Gene scores for indicated conditions (right). Each dot represents one sgRNA (n = 5 tumours). (d) Gene scores for in vivo sgRNA competition assay performed in KRAS-mutant PDAC patient-derived xenografts (PDX). Each dot represents an sgRNA (n = 5 subcutaneous tumors). (e, f) Fold change cell number of GOT2-KO HY15549 cells transduced with indicated vectors grown 5 days under indicated conditions. Pyruvate (Pyr). (g) Fold change in cell number of HY15549 cells grown 5 days in regular or conditioned media from hPSCs (hPSC CM) with or without monocarboxylate transporter inhibitor AR-C155858 (5 μM). (h) Immunoblot analysis of indicated cells under indicated conditions with vinculin as loading control. (i). Representative bright-field micrographs of indicated cells grown 6 days in the indicated media. Scale bar = 50 μM (left). Quantification graph (right); aspartate (20 mM). (j) Weights, images, and immunoblot analysis of indicated tumors with vinculin loading control (right). (k) Relative aspartate abundance normalized to lysine levels of established xenografts from indicated cells transduced with indicated vectors. (l) Immunoblot of SLC1A3 in indicated cell lines with b-actin loading control. (m) SLC1A2 and SLC1A3 mRNA expression data from the Cancer Cell Line Encyclopedia (CCLE) (log transformed) in KP PDAC cell lines and a glioma cell line (KNS-42). (n) Relative abundance of indicated metabolites in the culture media of indicated MIA PaCa-2 cells grown under indicated conditions for 24 hours in the presence of pyruvate (100 μM). c, d, e, f, g, i, k, n Bars represent mean ± s.d. b, j, boxes represent the median, first, and third quartiles; whiskers represent the minima and maxima. c, d, e, f, g, i, k, n, n = 3; b, n = 10; j, n = 5; k, n = 4. All replicates are biologically independent. Statistical significance determined by two-tailed unpaired t-test.
