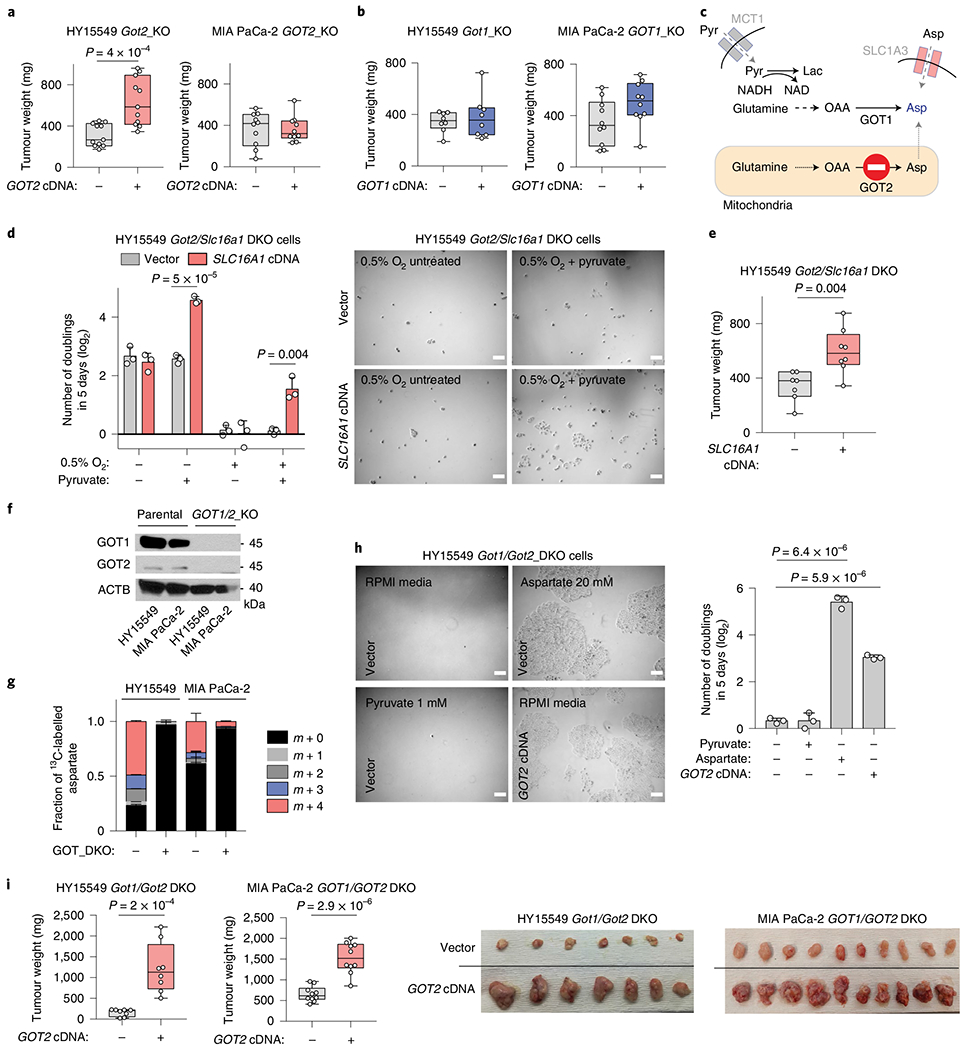
Fig. 2 |. The plasticity of aspartate metabolism in PDAC tumours.

a,b, Weights of subcutaneous tumour xenografts derived from GOT2 (a) and GOT1-knockout (KO) (b) cell lines transduced with a control vector or an sgRNA-resistant cDNA. c, Scheme depicting metabolic pathways that compensate for the loss of aspartate synthesis in GOT2-knockout cells. d, Number of doublings (log2) of Got2/Slc16a1 double-knockout (DKO) HY15549 cells transduced with a control vector or an sgRNA-resistant SLC16A1 cDNA after 5 days of growth in the absence or presence of pyruvate (100 μM) (left). Representative bright-field micrographs of indicated cells under 0.5% O2 in the presence or absence of pyruvate (100 μM). Scale bar, 50 μm (right). e, Weights of subcutaneous tumour xenografts derived from the Got2/Slc16a1 double-knockout HY15549 cells transduced with a control vector or an sgRNA-resistant SLC6A1 cDNA. f, Immunoblot analysis of GOT1 and GOT2 in indicated cell lines. ACTB was used as loading control. g, Fraction of 13C-labelled aspartate in indicated cell lines cultured for 8 h in the presence of 0.5 mM [U-13C]-l-glutamine. h, Representative bright-field micrographs (left) and number of doublings (log2) (right) of Got1/Got2-double-knockout HY15549 cells transduced with a control vector or an sgRNA-resistant GOT2 cDNA grown for 5 days in indicated culture conditions. Scale bar, 50 μm (left). i, Weights of subcutaneous tumour xenografts derived from the indicated Got1/Got2 double-knockout cell lines transduced with a control vector or an sgRNA-resistant GOT2 cDNA (left). Representative images of indicated tumours (right). a,b,e,i, boxes represent the median, and the first and third quartiles, and the whiskers represent the minima and maxima of all data points. d,g,h, Bars represent mean± s.d. a,b,e,i, n = 11, 11, 10, 10, 8, 8, 10, 10, 7, 8, 8 and 8 biologically independent samples in each graph shown, respectively. d,g,h, n = 3 biologically independent samples. Statistical significance was determined by a two-tailed unpaired t-test.
