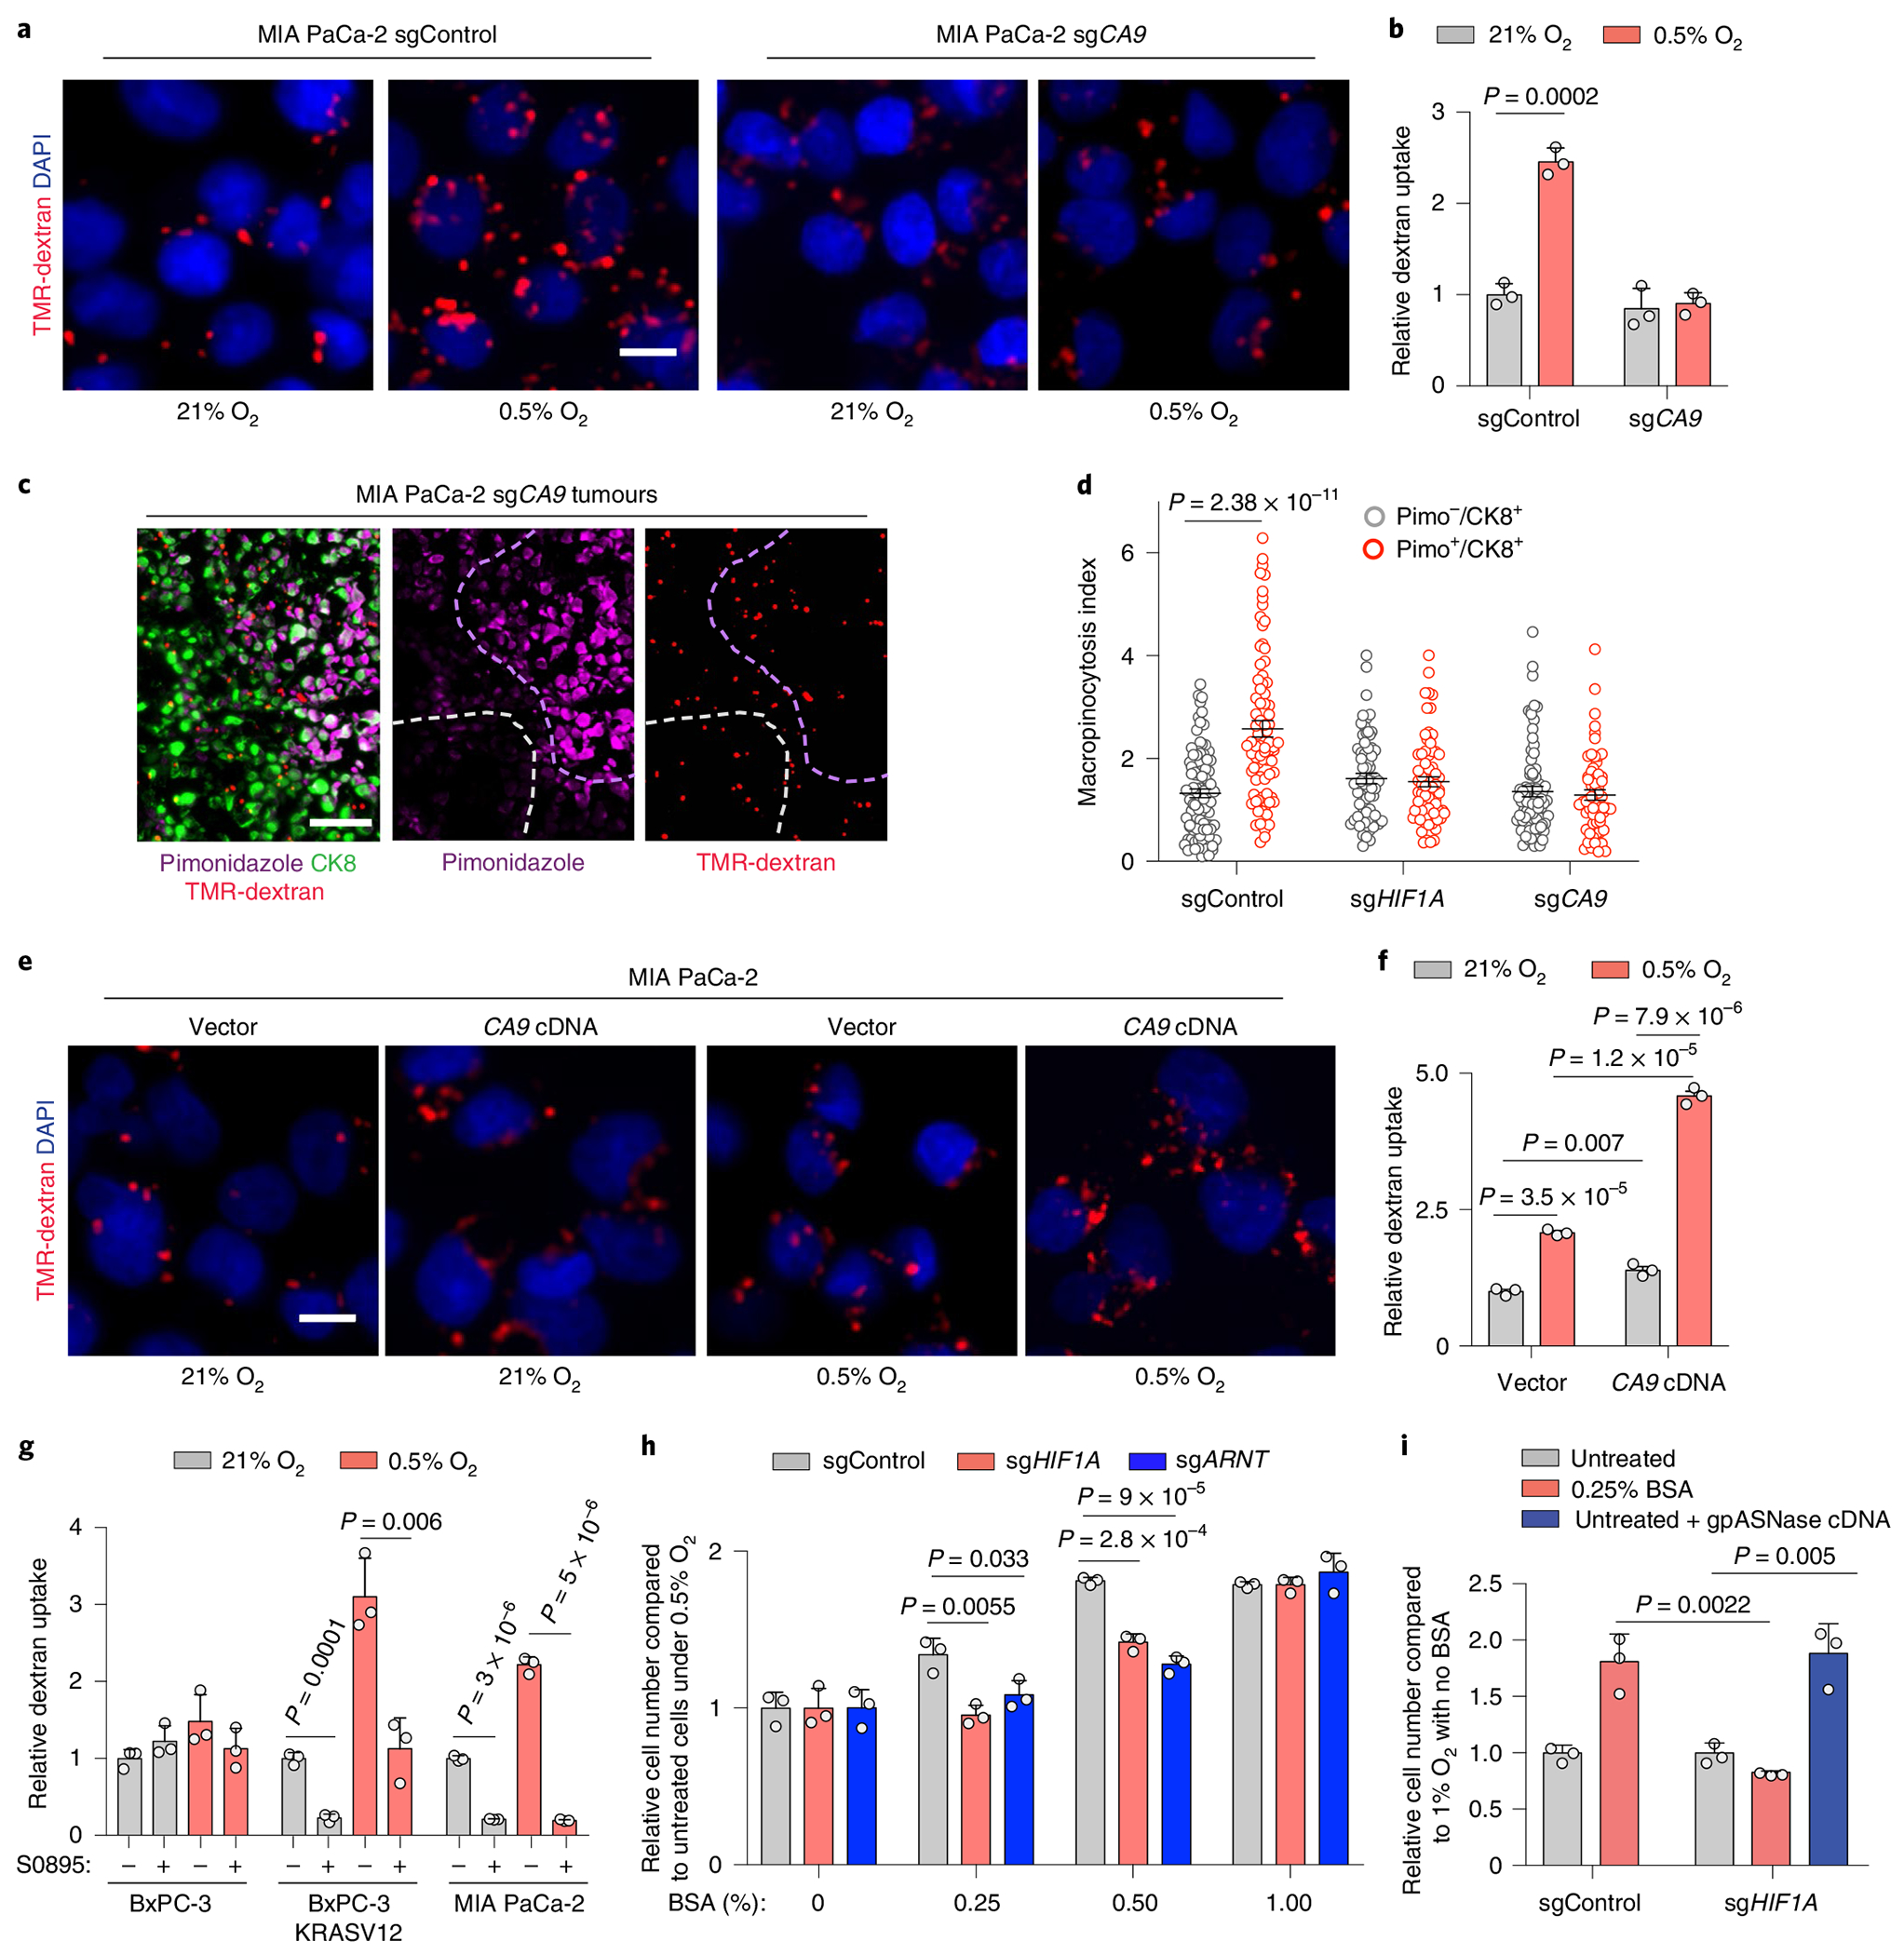
Fig. 6 |. The HIF1A target CA9 is required for the upregulation of macropinocytosis in response to hypoxia.

a,b, Representative images (a) and quantification (b) of TMR-dextran (red) uptake in sgControl or sgCA9-transduced MIA PaCa-2 cells under indicated conditions. Nuclei are blue. Scale bar, 10 μm. Data are normalized to values in normoxic control cells. c, Representative images from sections of xenograft tumours derived from MIA PaCa-2 cells transduced with an sgRNA targeting CA9 showing macropinosomes (red), CK8+ tumour cells (green) and hypoxic areas (purple). Nuclei are blue. Dashed lines indicate hypoxic (purple) and normoxic (white) areas. Scale bar, 50 μm. d, Quantification of macropinocytic uptake in c for hypoxic (CK8+/Pimo+, red) and normoxic tumour areas (CK8+/Pimo−, grey) in tumours arising from cells transduced with an sgControl, sgHIF1A or sgCA9. Data are presented relative to those of non-hypoxic areas in sgControl-transduced tumours. e,f, Representative images (e) and quantification (f) of TMR-dextran (red) uptake in control or CA9 overexpressing MIA PaCa-2 cells under indicated conditions. Nuclei are blue. Scale bar, 10 μm. In f, data are normalized to values in normoxic controls. g, Quantification of dextran uptake in the indicated cell lines treated with the bicarbonate transporter inhibitor S0895 (15 μM) as shown under indicated conditions. Data are normalized to values in normoxic, untreated controls. h, Relative cell number of the indicated MIA PaCa-2 cell lines grown for 5 days under hypoxia (0.5% O2) with increasing concentrations of BSA (0–1%). Data are presented relative to hypoxic cells transduced with a control sgRNA and cultured without BSA. i, Relative cell number in the indicated MIA PaCa-2 cell lines transduced with a control vector or gpASNase cDNA grown for 5 days under hypoxia (1% O2) and in the absence or presence of BSA (0.25%). Data are presented relative to values obtained for sgControl hypoxic cells cultured without BSA. b,d,f,g, Bars represent mean ± s.e.m.; At least 500 (b,d,g) or 300 (f) cells were quantified in each biological replicate (n = 3). h,i, Bars represent mean ± s.d., n = 3 biologically independent samples. Statistical significance was determined by a two-tailed unpaired t-test.
