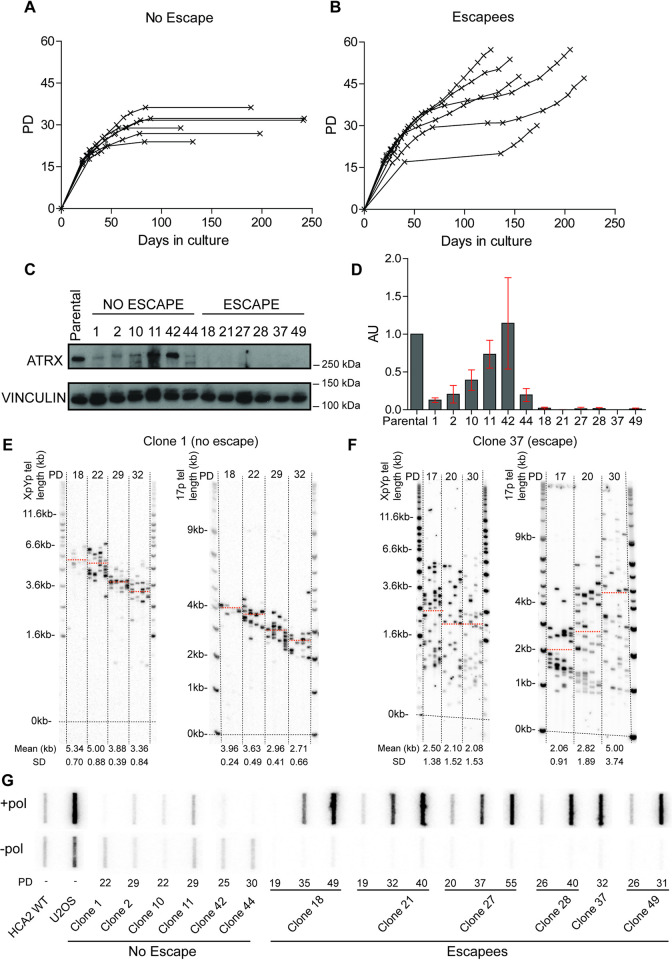
Fig 1. ALT upregulation and maintenance in the absence of ATRX in primary fibroblasts undergoing a telomere-driven “crisis”.
Growth curves displaying PDs graphed against days in culture for (A) HCA2HPVE6E7 clones (n = 6) that failed to escape crisis and (B) HCA2HPVE6E7 clones (n = 6) that successfully escaped crisis. (C) Western blots displaying ATRX protein expression in “no escape” and “escape” clones with vinculin expression used as a loading control. (D) Quantification of the ATRX protein expression using the ATRX:vinculin ratio normalised to the parental cell line expressed in arbitrary units (AU) with the standard deviation (SD) used as error bars and the clone number displayed across the bottom. STELA profiles at the XpYp and 17p chromosome ends for (E) clone 1 that failed to escape crisis and (F) clone 37 that successfully escaped crisis; with the PD indicated across the top and the mean telomere length in kb, also represented as orange dotted lines on the blot, and SD across the bottom. (G) C-circle assay slot blots with (+ pol) and without (- pol) polymerase samples with the PD and clone number stated across the bottom.

