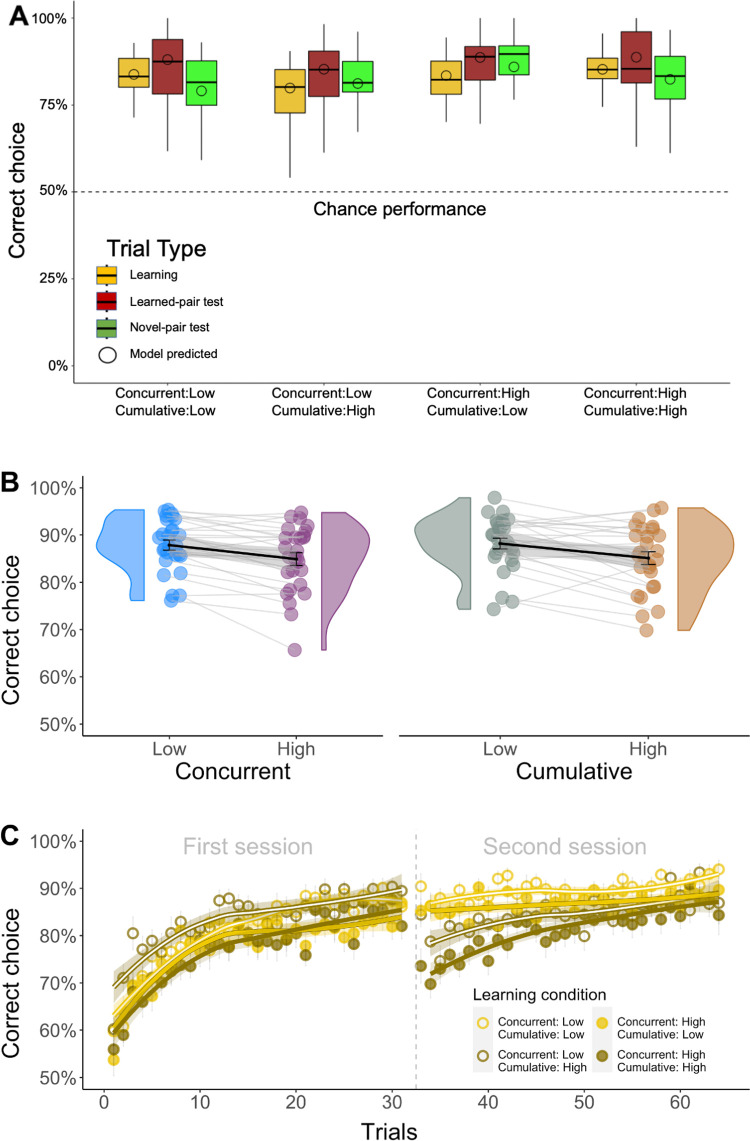
Fig 2. Overall performance. n = 27 subjects.
A) Choice accuracy as a function of trial type and condition. A choice was considered accurate if the subject selected the image with the higher reward probability. Subjects performed significantly above chance (50%) in all trial types and conditions (CI = [.834,.879]). The plot shows total (vertical lines) and interquartile (boxes) ranges and medians (horizontal lines). Also shown are mean accuracies predicted by a computational model that was fitted to subjects’ choices (circles; see details under Computational Formalization below). B) Effect of training diversity on accuracy during learning. Accuracy was higher in sessions with low (91% SEM ±1%) compared to high (87% SEM ±1%) concurrent diversity (pcorrected = .048, bootstrap test), and trended higher in sessions with low (90% SEM ±1%) compared to high (88% SEM ±1%) cumulative diversity (pcorrected = .078, bootstrap test). The plot shows individual subject accuracy (circles), group distributions of accuracy levels (violin), group means (thick lines) and standard errors (gray shading). C) Learning curves for each experimental condition. Accuracy in trials involving a given image as a function of how many trials the image previously appeared in. A drop-off in accuracy can be observed for high-cumulative-diversity images (dark) at the beginning of the second session, because these images were then pitted against new images. The plot shows group means (circles), standard errors (vertical lines), local polynomial regression lines ([33]; curves) and confidence intervals (shading). Given that performance was always above chance (50%), y-axes in panels B and C focus on this range.

