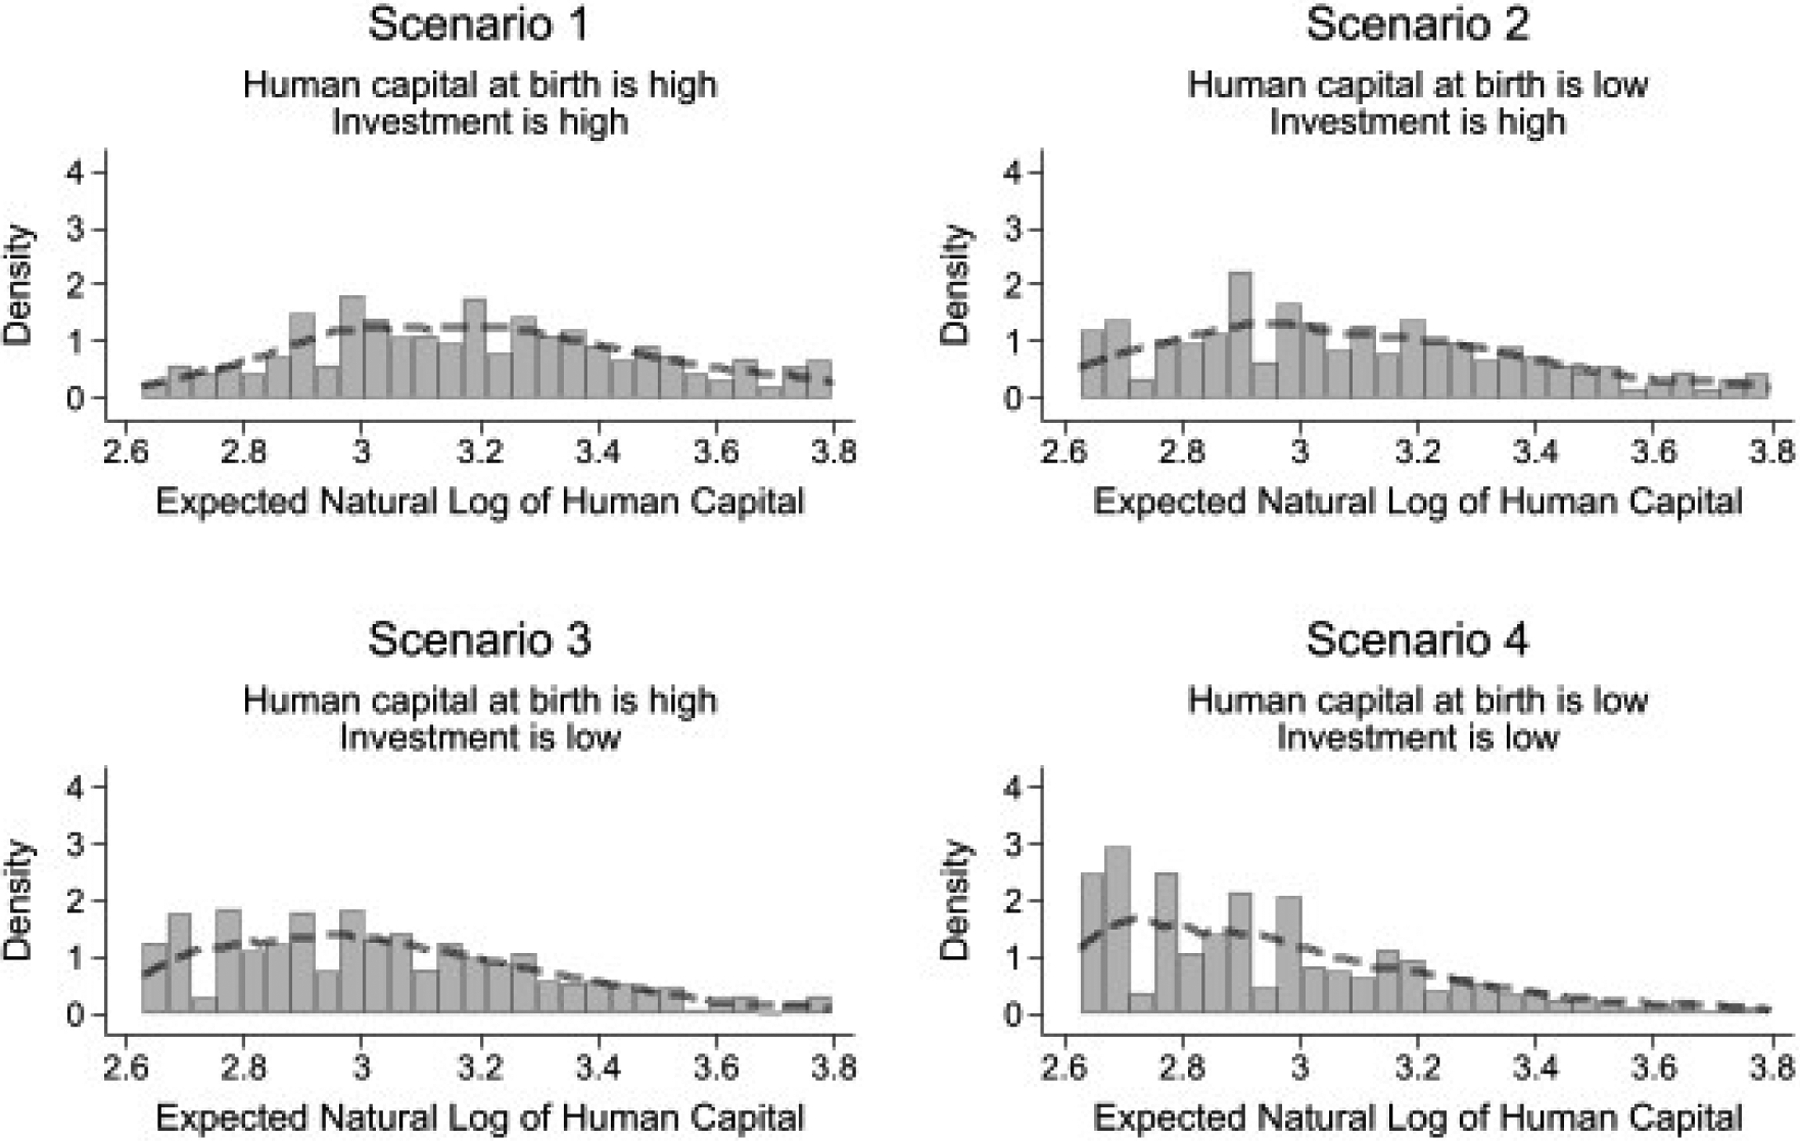
Figure 10:

This figure shows the histograms of the averaged error-ridden measures of the expectation of the natural log of human capital for each scenario when we average across MSD items for the age ranges elicitation form. To produce this figure, we follow three steps. In the first step, we use the normal CDF as the interpolating function (with parameters Δ0 = 10% and Δ1 = 90%), to transform the age ranges data to subjective probability data. We do so for each MSD item and each scenario separately. Then, we use the IRT model (3), for each MSD item and scenario, to relocate and rescale the subjective probability data to the expectation of the natural log of human capital at age two years. In the last step, we average across MSD items for each scenario.
