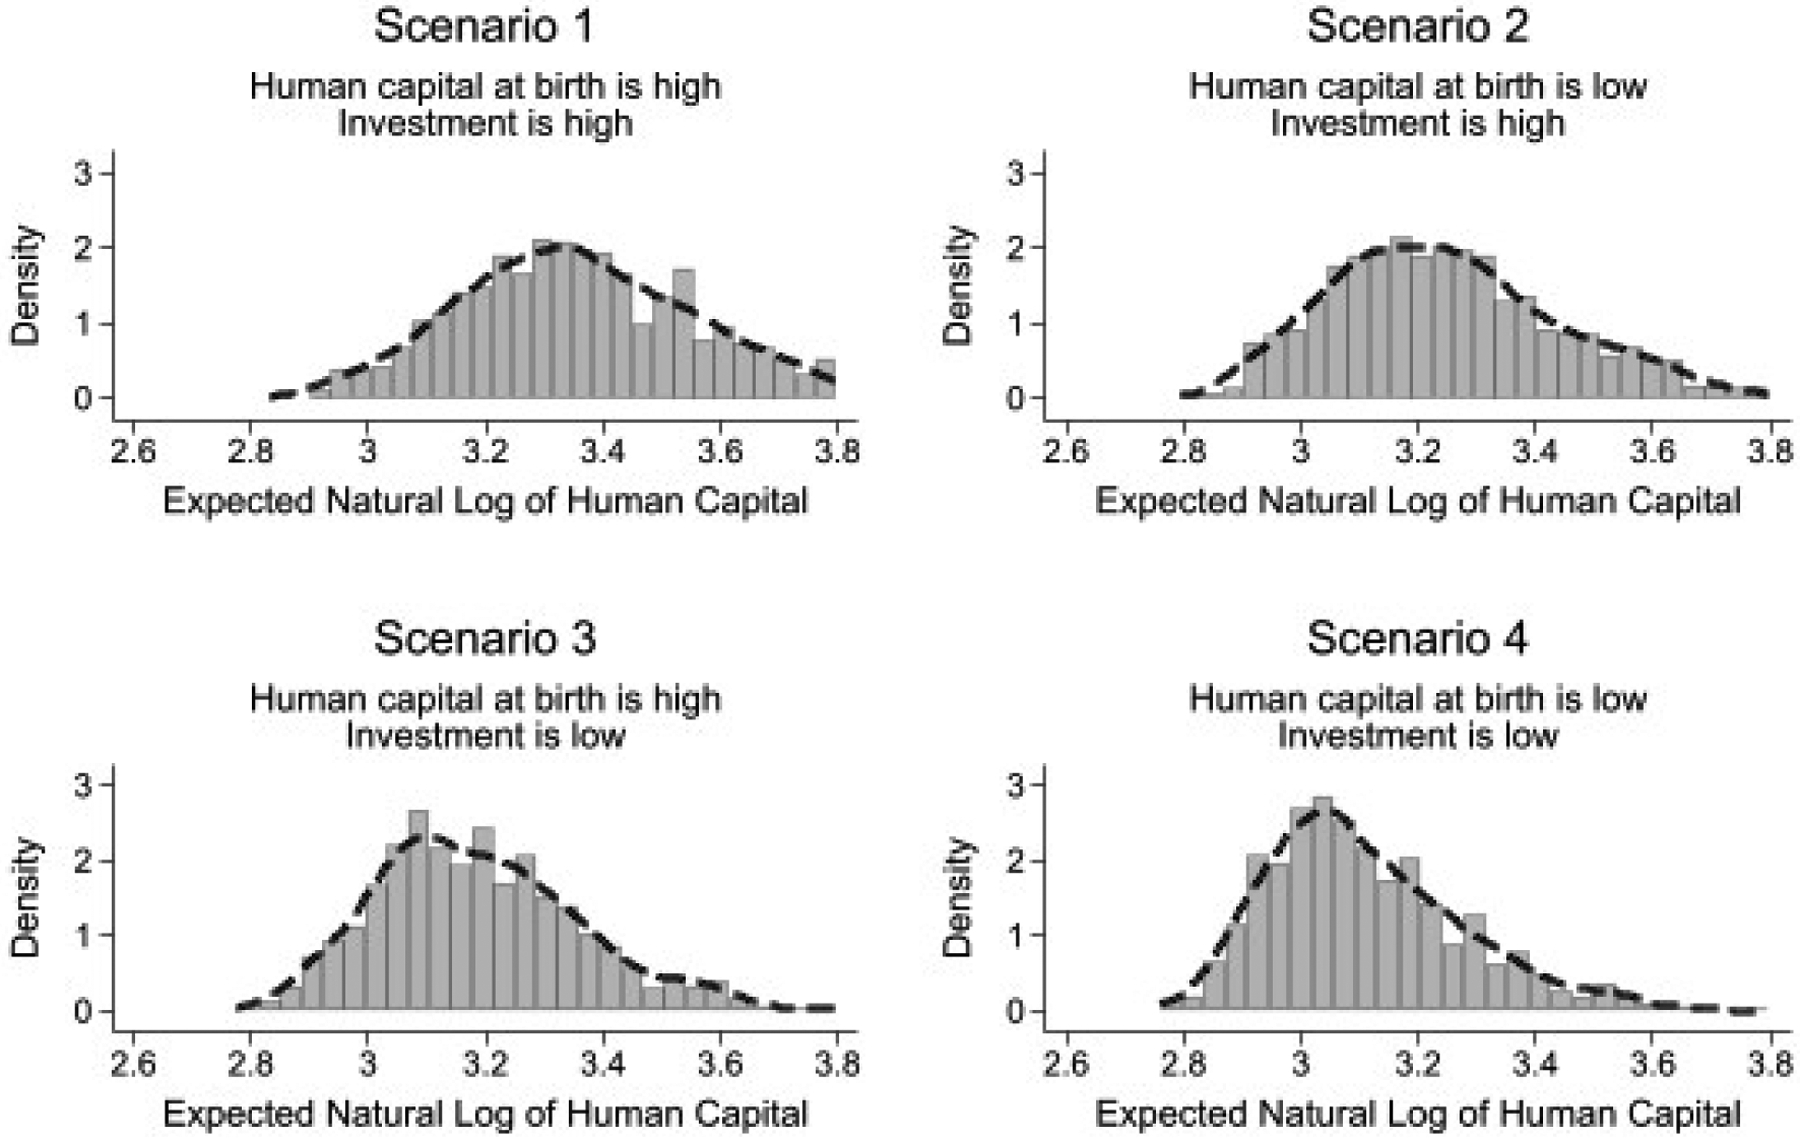
Figure 11:

This figure shows the histograms of the averaged error-ridden measures of the expectation of the natural log of human capital for each scenario when we average both across MSD items and elicitation forms. We remark that Figure 6 and Figure 10 present the histograms when we average across MSD items but not across elicitation forms. Once we average across both MSD items and elicitation forms, as shown in this figure, we have eliminated all forms of heaping. The estimator of the MSE also averages the data across MSD items and elicitation forms but does so in an efficient manner.
