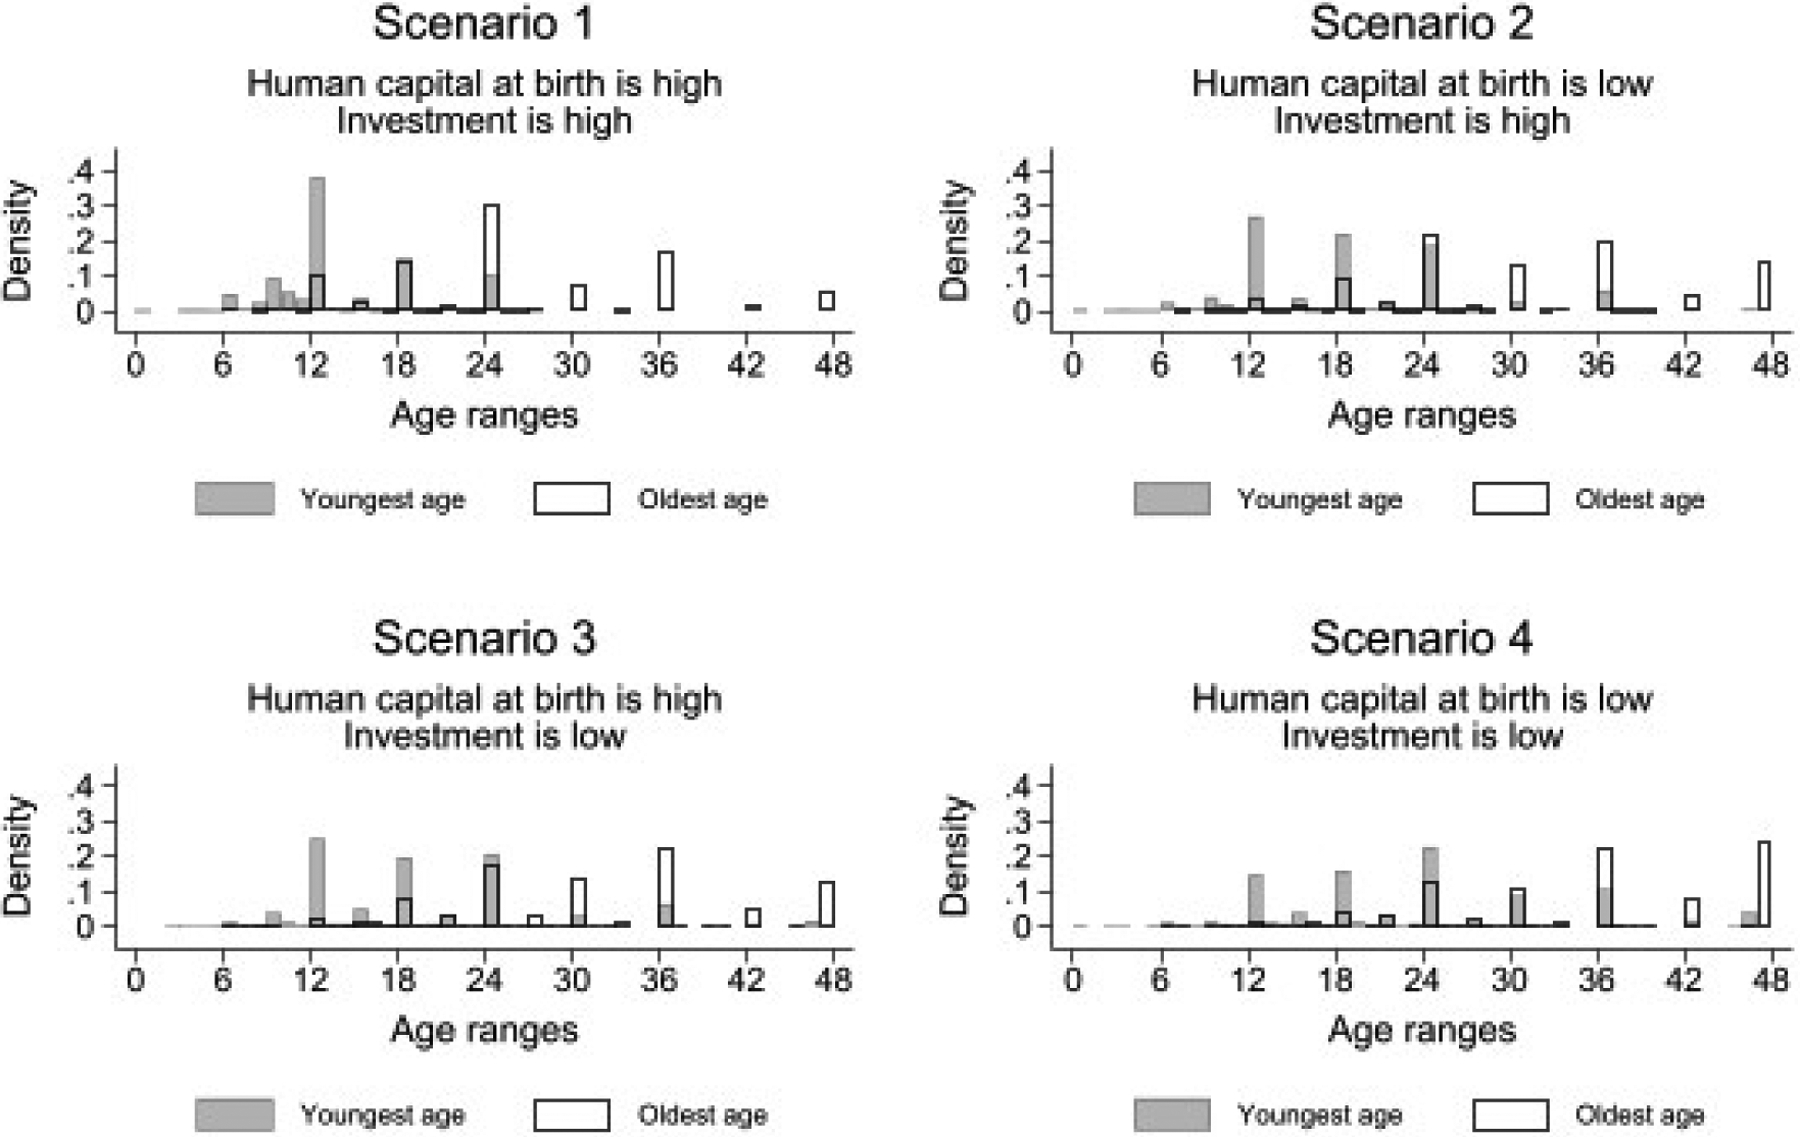
Figure 7:

This figure plots the histograms of maternal reports of age ranges for the MSD item “speak a partial sentence with three words or more.” The solid gray bars show the youngest ages children will learn this MSD task for each scenario of human capital at birth and investments. The solid white bars show the oldest ages. This figure shows heaping around multiples of six months. This heaping pattern is similar to the one observed for the subjective probability data that we show in Figure 4.
