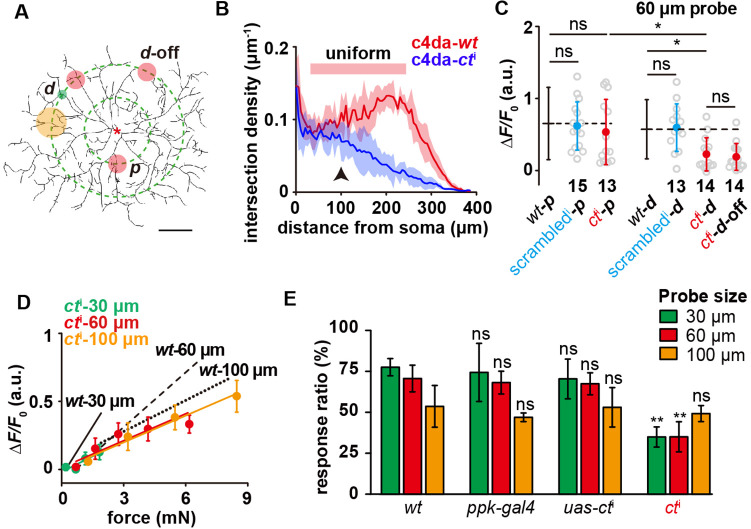
Figure 3. The contribution of dendritic morphology to the sensory features of c4da.
(A) The schematic showing the force application points (filled circles, green: 30 μm probe, red: 60 μm probe, orange: 100 μm probe) on c4da-cti. The dashed concentric circles were 100 and 200 μm in radius, respectively. (p) proximal dendrite. (d) distal dendrite. d-off: the ’dendrite-off’ region. Asterisk: the soma. Scale bar, 100 μm. Genotype: ppk-gal4/+, ppk-cd4-tdtom/uas-cti. (B) Modified Sholl analysis on the morphology of c4da-wt and c4da-cti. Note that there was a broad region in c4da-wt (red bar) in which the dendritic density was nearly constant. The shadow areas represented standard deviations. n=5 cells for each genotype. The black arrowhead indicated the regions of proximal dendrites. (C) The responses of c4da-cti (ΔF/F0) to the force stimuli (4 mN) applied onto the proximal and distal dendrites using a 60 μm probe. The numbers of cells were indicated below the scattered data points. Mann Whitney U test was used. *: p<0.05. ns: no significance. cti: ppk-gal4/20×uas-ivs-gcamp6s, ppk-cd4-tdtom/uas-cti. scrambledi: ppk-gal4/20×uas-ivs-gcamp6s, ppk-cd4-tdtom/uas-scrambledi. (D) The responses of c4da-cti (ΔF/F0) to the forces applied on the distal dendrites using the probes of different sizes. Data were presented as mean ± sem (n=10 cells). (E) The behavioral responses of cti larvae to mechanical poking using the probes of different sizes. wt: w1118. ppk-gal4: ppk-gal4; +/+. uas-cti: +/+; uas-cti. cti: ppk-gal4/+; uas-cti/+. ppk-gal4 larvae: 30 μm probe (n=63 larvae from three experiments), 60 μm probe (n=60 larvae from three experiments) and 100 μm probe (n=68 larvae from three experiments). uas-cti larvae: 30 μm probe (n=68 larvae from three experiments), 60 μm probe (n=72 larvae from three experiments) and 100 μm probe (n=63 larvae from three experiments). cti larvae: 30 μm probe (n=97 larvae from four experiments), 60 μm probe (n=91 larvae from four experiments) and 100 μm probe (n=91 larvae from four experiments). One-way ANOVA test was used. **: p<0.01. ns: no significance. In panels (C), (D) and (E), the corresponding data from c4da-wt were provided for comparison. In panel (C) and (E), data were presented as mean ± std.


