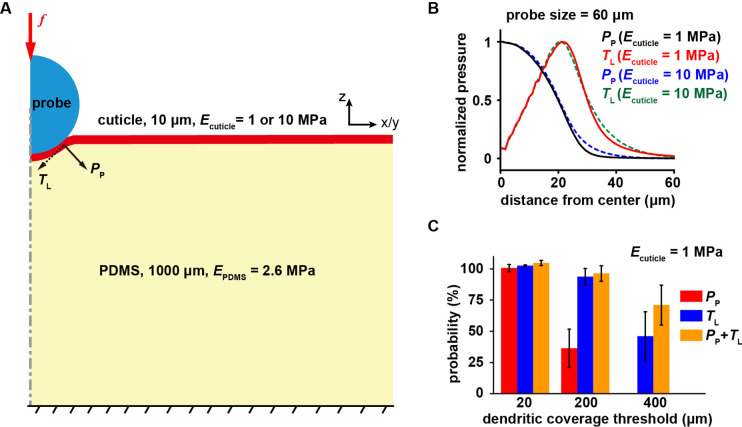
Figure 4. The mechanosensitivity of c4da to lateral tension.
(A) The responses of c4da (ΔF/F0) to the d-off stimuli (4 mN, 60 μm probe) applied at different positions.The numbers of cells were indicated below the scattered data points. Mann Whitney U test was used. **: p<0.01. *: p<0.05. ns: no significance. Genotype: ppk-gal4/+; ppk-cd4-tdtom/20×uas-ivs-gcamp6s. (B) Left panel: representative heat maps showing the 2D distributions of pressure perpendicular to the cuticle surface (PP) and tension parallel with the cuticle surface (TL) of the 30 μm (upper) and 60 (lower) μm probes. Scale bar, 30 μm. Right panels: representative line profiles (normalized) showing the distribution of PP and TL versus the distance to the center of the force probe. Indentation depth: 20 μm. (C) The representative color map for the distance to the nearest dendrite, in which the distance was color-coded as indicated. Random positions were chosen (the red crosses) as the force application points in our simulations. Scale bar, 100 μm. (D–E) The activation probability in three conditions: (1) only sensitive to PP; (2) only sensitive to TL; (3) sensitive to both PP and TL. The dendritic coverage threshold (Cd) was the minimal length of activated dendrites that could excite neuronal responses. For each condition, 100 random positions and two sizes of probes (panel D) 30 μm; (panel E) 60 μm were used in our simulations for each cell (n=5 cells). In panel (A), (D) and (E), data were presented as mean ± std.


