. 2022 Nov 8;11:e80395. doi: 10.7554/eLife.80395

Figure 1. PgfA is an essential polar growth factor that localizes asymmetrically.

(A) Top: Graphical depiction of growth pattern in wild type (WT) and ΔlamA cells. Green = old cell wall material. Gray = new cell wall material. Bottom: LamA is a membrane protein that co-immunoprecipitates with PonA1, a bifunctional penicillin binding protein, and MSMEG_0317/PgfA, a protein of unknown function. (B) Schematic and results of allelic exchange experiment. Vectors with pgfA or without pgfA (tetR) were transformed into a strain whose only copy of pgfA was at the L5 integration site. Transformants carrying the incoming vectors were counted by colony forming units (CFU). (C) A strain whose only copy of PgfA is tetracycline inducible was imaged over time with (+pgfA) or without (-pgfA) anhydrotetracycline (ATC). Cells were loaded into a microfluidic device 18 hr after the removal of ATC (bottom) or a mock control (top). (D) Cells whose only copy of PgfA was fused to mRFP were imaged over time by phase and fluorescence microscopy in a microfluidic device with constant perfusion of media. (E) Top: Individual cells (N=25) were followed from birth to division and the fluorescence was measured from new to old pole. Each resulting kymograph was interpolated over cell length and time and then averaged together. Using this analysis, we find that PgfA is first at the old poles (pink triangles), partially re-localizes to the septum (yellow triangles) during cell division, and then disappears from the site of division before the next cell cycle (blue triangles) to establish asymmetry in the next generation. Bottom: A depiction of this localization pattern is shown as a cartoon.

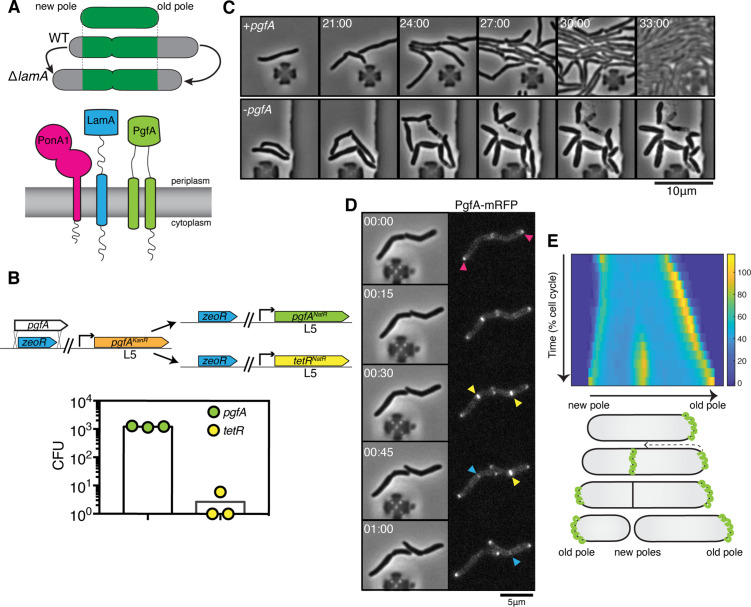
Figure 1.

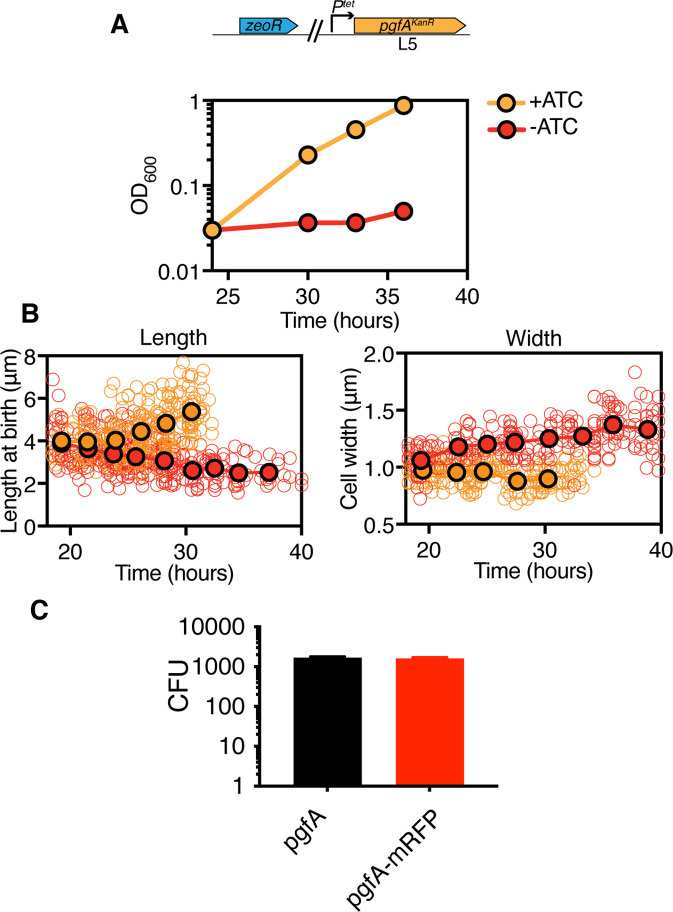
Figure 1—figure supplement 1. PgfA is essential and depletion leads to reductive cell division.

Figure 1—figure supplement 1.

(A) Optical density over time of a strain whose only copy of pgfA is tetracycline inducible, with and without ATC (+/-ATC). Points are means of three biological replicates. Error bars are too small to be visible. Experiment was performed at least four times on separate days, and representative data are shown. ATC = anhydrotetracycline. Time on the x-axis corresponds to time after ATC was removed. (B) Birth lengths and cell widths over time of depletion (orange = +ATC; red = -ATC). Open circles represent individual cells (length: N=261 (length) and 253 (width) for +ATC; N=355 (length) and 254 (width) -ATC). Closed circles are not fit to the data but represent the mean of cells in 2.25 hr (length) or 2.75 hr (width) bins. The experiment was performed twice on separate days. In +ATC cultures, cell density became too high to measure length and width past ~33 hr. ATC = anhydrotetracycline (C) L5-allele swapping with pgfA or pgfA-mRFP expressed by the native promoter. Bars represent means of three biological replicates. Error bars indicate standard deviation.

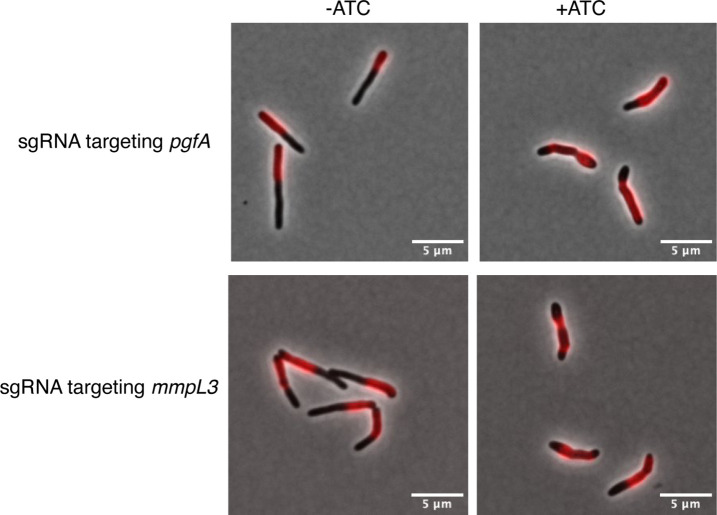
Figure 1—figure supplement 2. Cells depleted of PgfA and MmpL3 do not grow from their poles.

Figure 1—figure supplement 2.

Cells from a log-phase culture were stained overnight with the fluorescent D-amino acid dye RADA at a final concentration of 2mM. The next morning, those cultures were split into two tubes, one of which received 100ng anhydrous tetracycline (aTC) to deplete either MmpL3 or PgfA. After growing for 5hr of depletion, all cells were washed of fluorescent dye, allowed to outgrow for 3hr, and imaged to visualize the amount of newly incorporated cell envelope.

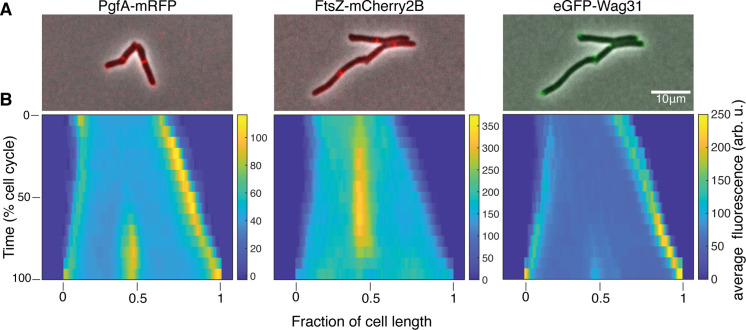
Figure 1—figure supplement 3. PgfA localizes to midcell and the poles.

Figure 1—figure supplement 3.

(A) Merged phase contrast and fluorescence images of Msm cells expressing PgfA-mRFP, eGFP-Wag31, and FtsZ-mCherry2b. (B) Average fluorescent distributions over time (kymographs) from cells aligned from new to old poles and from birth to division (N=20 PgfA-mRFP; N=48 FtsZ-mCherry2B; N=20 eGFP-Wag31).