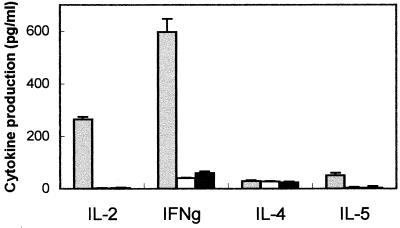
FIG. 7.
Cytokine profile induced by immunization with TolT protein. T cells were cultured with TolT protein (3 μg/ml) and irradiated syngeneic feeder cells. Supernatants were collected on days 2, 3, 5, and 7 of culturing and assayed for IL-2, IL-4, IL-5, and IFN-γ (IFNg) levels by a capture ELISA as described in Materials and Methods. Values for each cytokine are presented for the peak days of production, which were as follows: IL-2, day 2; IFN-γ, day 5; IL-4, day 3; and IL-5, day 5. The gray bars represent cultures of T cells from TolT-immunized mice cultured with antigen. The white bars represent cultures of T cells from TolT-immunized mice cultured without antigen. The black bars represent cultures of T cells from nonimmunized mice. Each bar represents the average values ± standard deviations obtained from triplicate cultures.

